
In its 2016 publication Data and Technology: Transforming the Financial Information Landscape, CFA Institute wrote about the benefits of structured data to all parties in the financial reporting supply chain. This is a follow-up to that paper.
Introduction
Regulators, such as the US Securities and Exchange Commission (SEC), currently have adopted, and as of 2020, the European Securities and Markets Authority (ESMA) will adopt, rules requiring companies to provide financial statement information in an interactive format. eXtensible business reporting language (XBRL), a global digital standard for exchanging business information, allows for digitally reporting all numerical facts and some textual information from financial statements and disclosures within those statements. This format enables investors to capture and analyze that information more quickly and at a lower cost. Any investor with a computer and an internet connection now has the ability to acquire and download interactive financial data that, in the past, were available only to large institutional users.
The CFA Institute publication Data and Technology: Transforming the Financial Information Landscape discusses the benefits of structured data to all parties in the financial reporting supply chain, including companies, auditors, regulators, and investors. This paper addresses the consumption of that structured data, including which data are available and how data are being consumed, and refutes the claim by some that the data are not being used. This paper also addresses the potential for structured data and how this potential can be realized—that is, what CFA Institute believes the future holds.
Consumption of Regulatory Filings: SEC
The SEC Financial Statement and Notes Data Sets provide the text and detailed numeric information from all financial statements as well as their notes. These data are extracted from exhibits to corporate financial reports filed with the SEC using XBRL. The information is presented without change from the as-filed financial reports that each registrant has submitted and therefore may represent the largest repository of US public company financial statement data.
Some useful tools are available on the SEC’s website, including the Inline XBRL Viewer1 and the Financial Statement Query Viewer (FSQV). For XBRL submissions made using Inline XBRL, the Commission’s open-source Inline XBRL viewer allows the public to identify disclosures by “topic” rather than by the more traditional “word search” approach. This capability enables any user to quickly identify all disclosures for a particular topic (e.g., “stock compensation”) within an Inline XBRL filing. In addition, the Inline XBRL viewer includes a range of filters that help filers more quickly identify disclosures associated with common data-quality errors. For example, with the Inline XBRL viewer, filers and investors can see how disclosures were tagged, learn whether the values were entered as positive or negative, and identify any scaling errors.2
The FSQV is an intuitive, quick, and easy-to-use web browser interface. It allows searches
- of all facts across all filings, which means users no longer have to search one filing at a time (e.g., users can aggregate a specific disclosure across all filers for a target period);
- using various criteria, including the Central Index Key, ticker, industry, filer status, and country;
- by text, including any text within a narrative disclosure; and
- by fact or topic instead of just by word or text.
Furthermore, users can
- compare footnote narrative differences from period to period via redline changes, that is, they can compare both numeric and sentiment changes and assess whether narrative sentiments are misaligned with the numbers;
- identify early adoption of a standard;
- view a specific combination of disclosures that may reveal a risk pattern;
- compare sector and risk profiles across targeted filers; and
- save all results and searches locally for further analysis and reuse.
The SEC Financial Statement and Notes Data Sets are CSV (comma-separated values) files that analysts can download into Excel for financial analysis. Because of the large quantity of data, however, it is not possible to download all of the files. Although awareness of the data sets and tools has been an issue, use of the data has recently picked up.
The XBRL US Data Analysis Toolkit allows users to obtain an application programming interface key to access all public company XBRL data available in the XBRL US database. The content is updated on an as-reported basis every 15 minutes through an RSS feed from the SEC’s EDGAR database. Users then can query the data, pull data into a spreadsheet, and build a data store in their own environment. Users could, for example, obtain a breakdown of pension assets held by various pension plans. This feature gives users an idea of where pension assets are being held and where they are concentrated, which is useful for pension plan managers or those selling asset management services to the pension sector.
As Scott Bauguess, SEC deputy chief economist and deputy director, points out, to take advantage of artificial intelligence (AI) and other advanced analytical tools, users need high-quality, digital, machine-readable data and metadata.3 Acknowledging the importance of increasingly open-source, AI algorithms, and the right people to use them, Bauguess emphasizes the critical role machine-readable data plays. The massive EDGAR database serves up 1.5 billion copies of documents filed by public companies with the SEC each year; currently, 85% of the downloads each day are made by bots, not humans (as shown by the EDGAR log files). According to Bauguess, the “SEC is fundamentally committed to ensuring that all investors and market participants can access the information necessary to make informed financial decisions.” Not surprisingly, an increasing number of participants want to use advanced technology like AI to help them make those decisions; the “bot” downloads are indicative of that trend.
To address this trend, the SEC is looking to ensure that humans and machines can read these reports equally well, and, through a proposed rule, is seeking to use Inline XBRL to ensure that this happens. Bauguess points out that “[t]his proposed rule, if adopted, would combine the two requirements and create a single document designed to be read equally well by humans and machines.”
Data Quality Issues
Although the Financial Statement and Notes Data Sets may be the largest repository of US public company financial statement data, data quality issues do exist. Examples include scaling errors, incorrect use of negative values, incorrect fiscal years, inappropriate use of extensions or “custom tags,” and incorrect or inconsistent tagging.
To address issues such as the incorrect use of negative values and scaling errors, CFA Institute urges filers to adopt the validation rules put forward by the XBRL US Data Quality Committee (DQC) of which CFA Institute is a member. Furthermore, CFA Institute believes that cross-referencing Financial Accounting Standards Board (FASB) codification to each element will reduce incorrect and inconsistent tagging—both within companies over time and across companies.
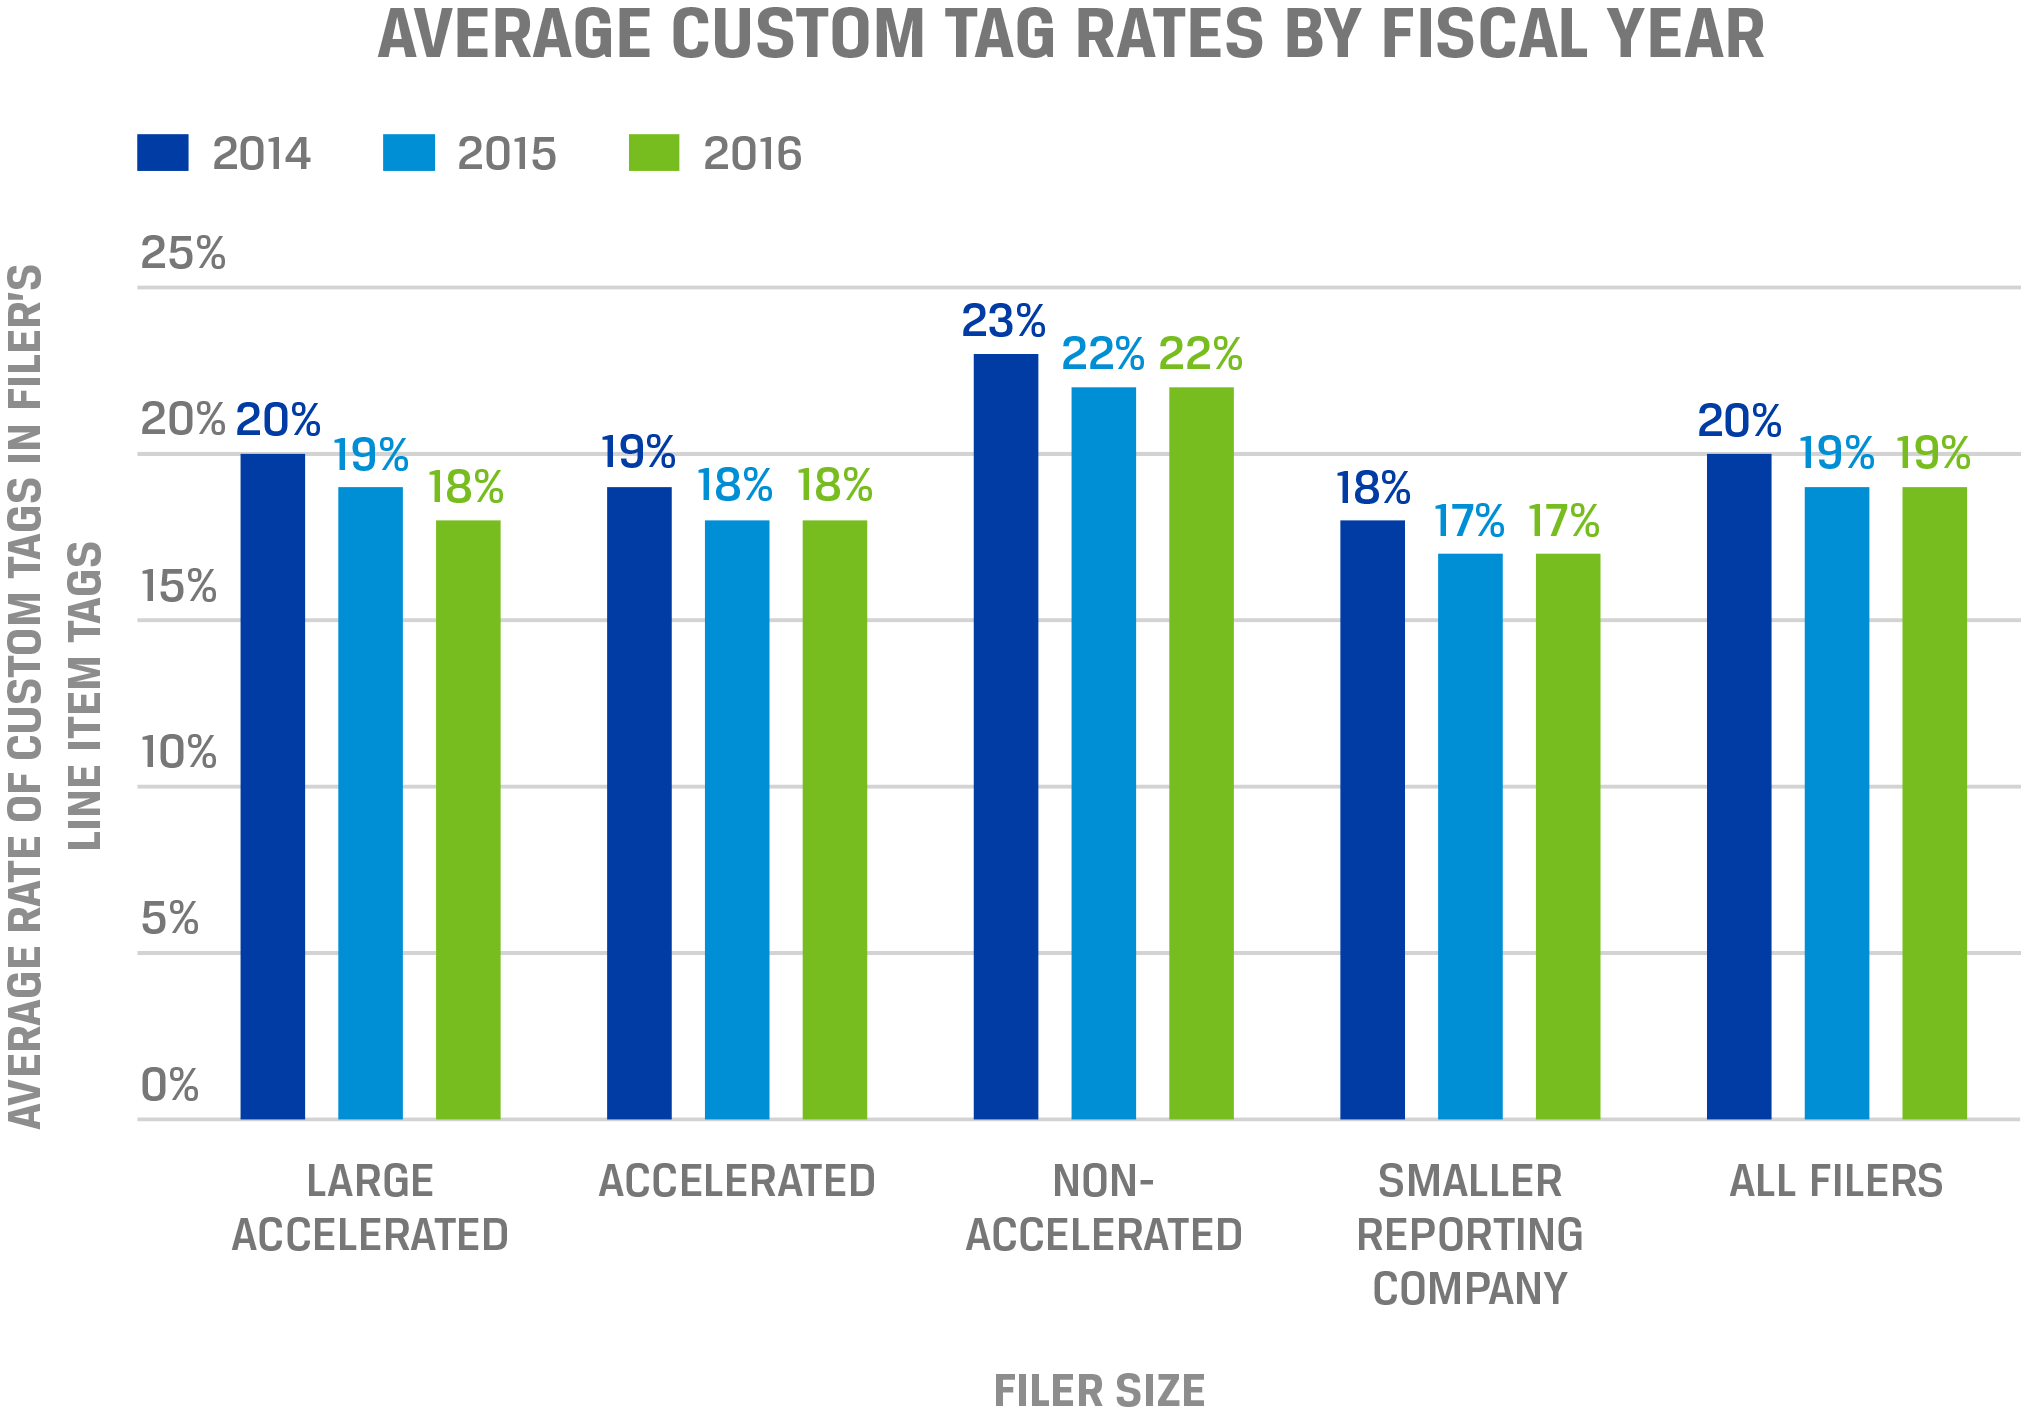
In the United States, however, the biggest problem seems to be that of extensions or company-specific tags that are not within the taxonomy or dictionary of tags. Indeed, some users report that approximately 80% of data elements can be mapped directly onto the US GAAP taxonomy, but that the remaining 20% are extensions. Such excessive use of extensions results in the need for manual intervention by users: analysis of extensions must be executed by hand, whereas analysis of a taxonomy element can be automated across companies.
The extensive use of custom tags is a key limitation with respect to the SEC data (Figure 1). Two steps can be taken to address this problem. First, CFA Institute believes that it is necessary to allow for the use of company-specific extensions within a framework that restricts their use to rare circumstances. In eXtensible Business Reporting Language: A Guide for Investors, CFA Institute maintains,
- Individual extensions should be limited to those rare situations in which an item unique to that firm exists and the information about it does not fit into any of the concepts within the standard taxonomy or extension. We strongly encourage reporting companies to look first for the appropriate tag within the existing taxonomy before turning to a custom extension. If such a tag does not exist, we believe an extension should be allowed but within a well-defined framework so that no extension corrupts other financial statement relationships. Simply put, the automated relationships required by the computer remain: When a custom tag is inserted, the relationships remain intact and the numbers continue to sum up correctly.4
Second, companies should be required to “anchor” all extensions to the base taxonomy by providing an explicit relationship. In 2020, ESMA will require all such extensions to be anchored. CFA Institute contends that the SEC should make this a requirement as well.
Data Providers
Data providers are building increasingly advanced consumption tools. Data providers have explained how they pull the SEC’s XBRL data, normalize and clean it for the aforementioned errors, and present it to users in a manner that allows easy access and immediate analysis as well as the ability to export it into an Excel spreadsheet. Providers leverage the XBRL data to be able to trace the data point on the provider’s platform back to the source document.
A great deal of information in the textual component of an SEC filing also can be presented in a structured manner and more easily consumed by investors. Providers build upon the XBRL technology to further tag and improve the readability and usability of financial documents, for example by tagging non-GAAP information, items such as product warranty accruals; the management discussion and analysis (MD&A); earnings releases; SEC comment letters; and environmental, social, and governance data. This information overlays the XBRL data from the SEC.
Data providers build these tools to meet user demand for greater tagging of information. Tagging the earnings release, for example, allows users to export data from the earnings release directly into documents or into an Excel-based financial model. Users then can perform side-by-side comparisons of preliminary income statements against previously reported numbers, without having to manually input the data. This simplifies the process for financial analysts and reduces errors and the time spent pulling information manually for multiple companies. Analysts, for example, can more easily compare EBITDA and non-GAAP EBITDA; see whether similar companies have received SEC comment letters and how to avoid the same pitfalls; review the MD&A of a given company (e.g., Facebook to identify the number of active users); apply machine learning to block-tagged text to identify early adopters of the new revenue recognition standard; and search text by topic on SEC comment letters, MD&A, and annual and quarterly financial statements.
Indeed, in some jurisdictions, regulators are mandating that structuring be extended. Recently, The Netherlands has required companies to file XBRL-based annual reports with an accompanying electronically signed XBRL-formatted auditor’s opinion. The reports must be submitted to the Dutch Chamber of Commerce within the Netherlands Standard Business Reporting (SBR) framework in XBRL. The new mandate applies to all midsize businesses—those large enough to have their accounts audited while not being listed.
Because XBRL data cannot be consumed in a vacuum, some providers also incorporate nonfinancial data from the Federal Reserve, the US Food and Drug Administration, stock prices, forecasts, and the Federal Deposit Insurance Corporation call reports on their platforms. This additional information provides context for the XBRL data. For example, analysts gain context for the financial data from proxy statements given that the proxy often provides insights into corporate governance, and whether the leadership has compensation tied to long-term success.
Furthermore, to improve data quality, some providers have built in the validation rules of the EDGAR filings manual checks and the DQC, as well as variance threshold checks to identify anomalies. This validation process allows preparers to run their filings using the provider’s portal and check for errors before submitting the filing to the SEC. Of course, preparers also use these tools to analyze trends and benchmark multiple companies. Within a few clicks, users can compare—in a visual format—quarterly sales revenues from 2014 to 2017, or the time-series data of cash and cash equivalents for, say, Pfizer Inc., Johnson & Johnson, Merck & Co., Inc., and Bristol-Myers Squibb. As well, providers are getting ready to incorporate the data that will be available from ESMA in 2020.
In sum, XBRL is useful because it provides analysts with a fully searchable database of line-item details from SEC filings. Previously hard-to-find facts are no longer hard to find. The detailed segment breakouts, schedules, and roll forwards are available for searching, analyzing, and comparing over time and across companies. Users can examine company tax footnotes side by side; search geographic segment revenue for companies that report revenue in, for example, China; or drill into a footnote and then extract a concept from that same footnote, while asking who else might be reporting that concept and in what specific dollar amount.
Value of Structure Data: Illustrations
The following examples illustrate the value of structured data—that is, how information provided through XBRL is effective, efficient, and, above all, highly useful.
Revenue Recognition
The new Revenue Recognition rules are just now coming into play. Under Accounting Standards Codification 606, firms must adhere to a series of rules that will guide them as to when and how to recognize revenues. In some cases, the changes to revenue may be significant.
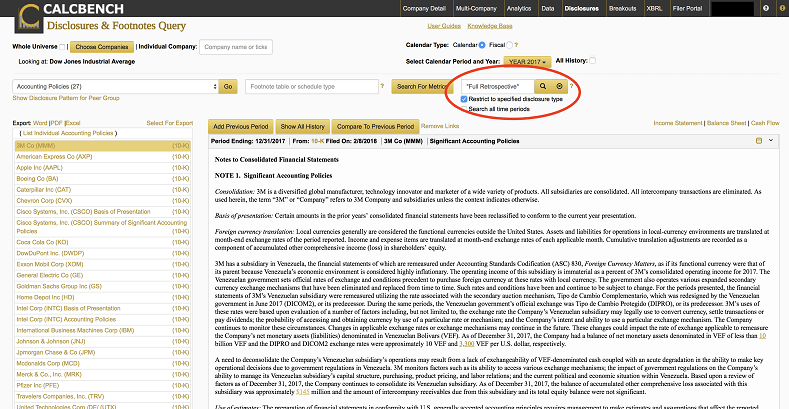
The Calcbench platform allows users to systematically access accounting policies and get information with a few mouse clicks (Figure 2). A user can search the Dow Jones firms’ accounting policies to learn who has referred to the “Full Retrospective” method of recognizing revenues.
If a user wishes to read the statements, they now can. They can also conduct a redline comparison of the accounting policy to the previous filing, which potentially may yield additional insight.
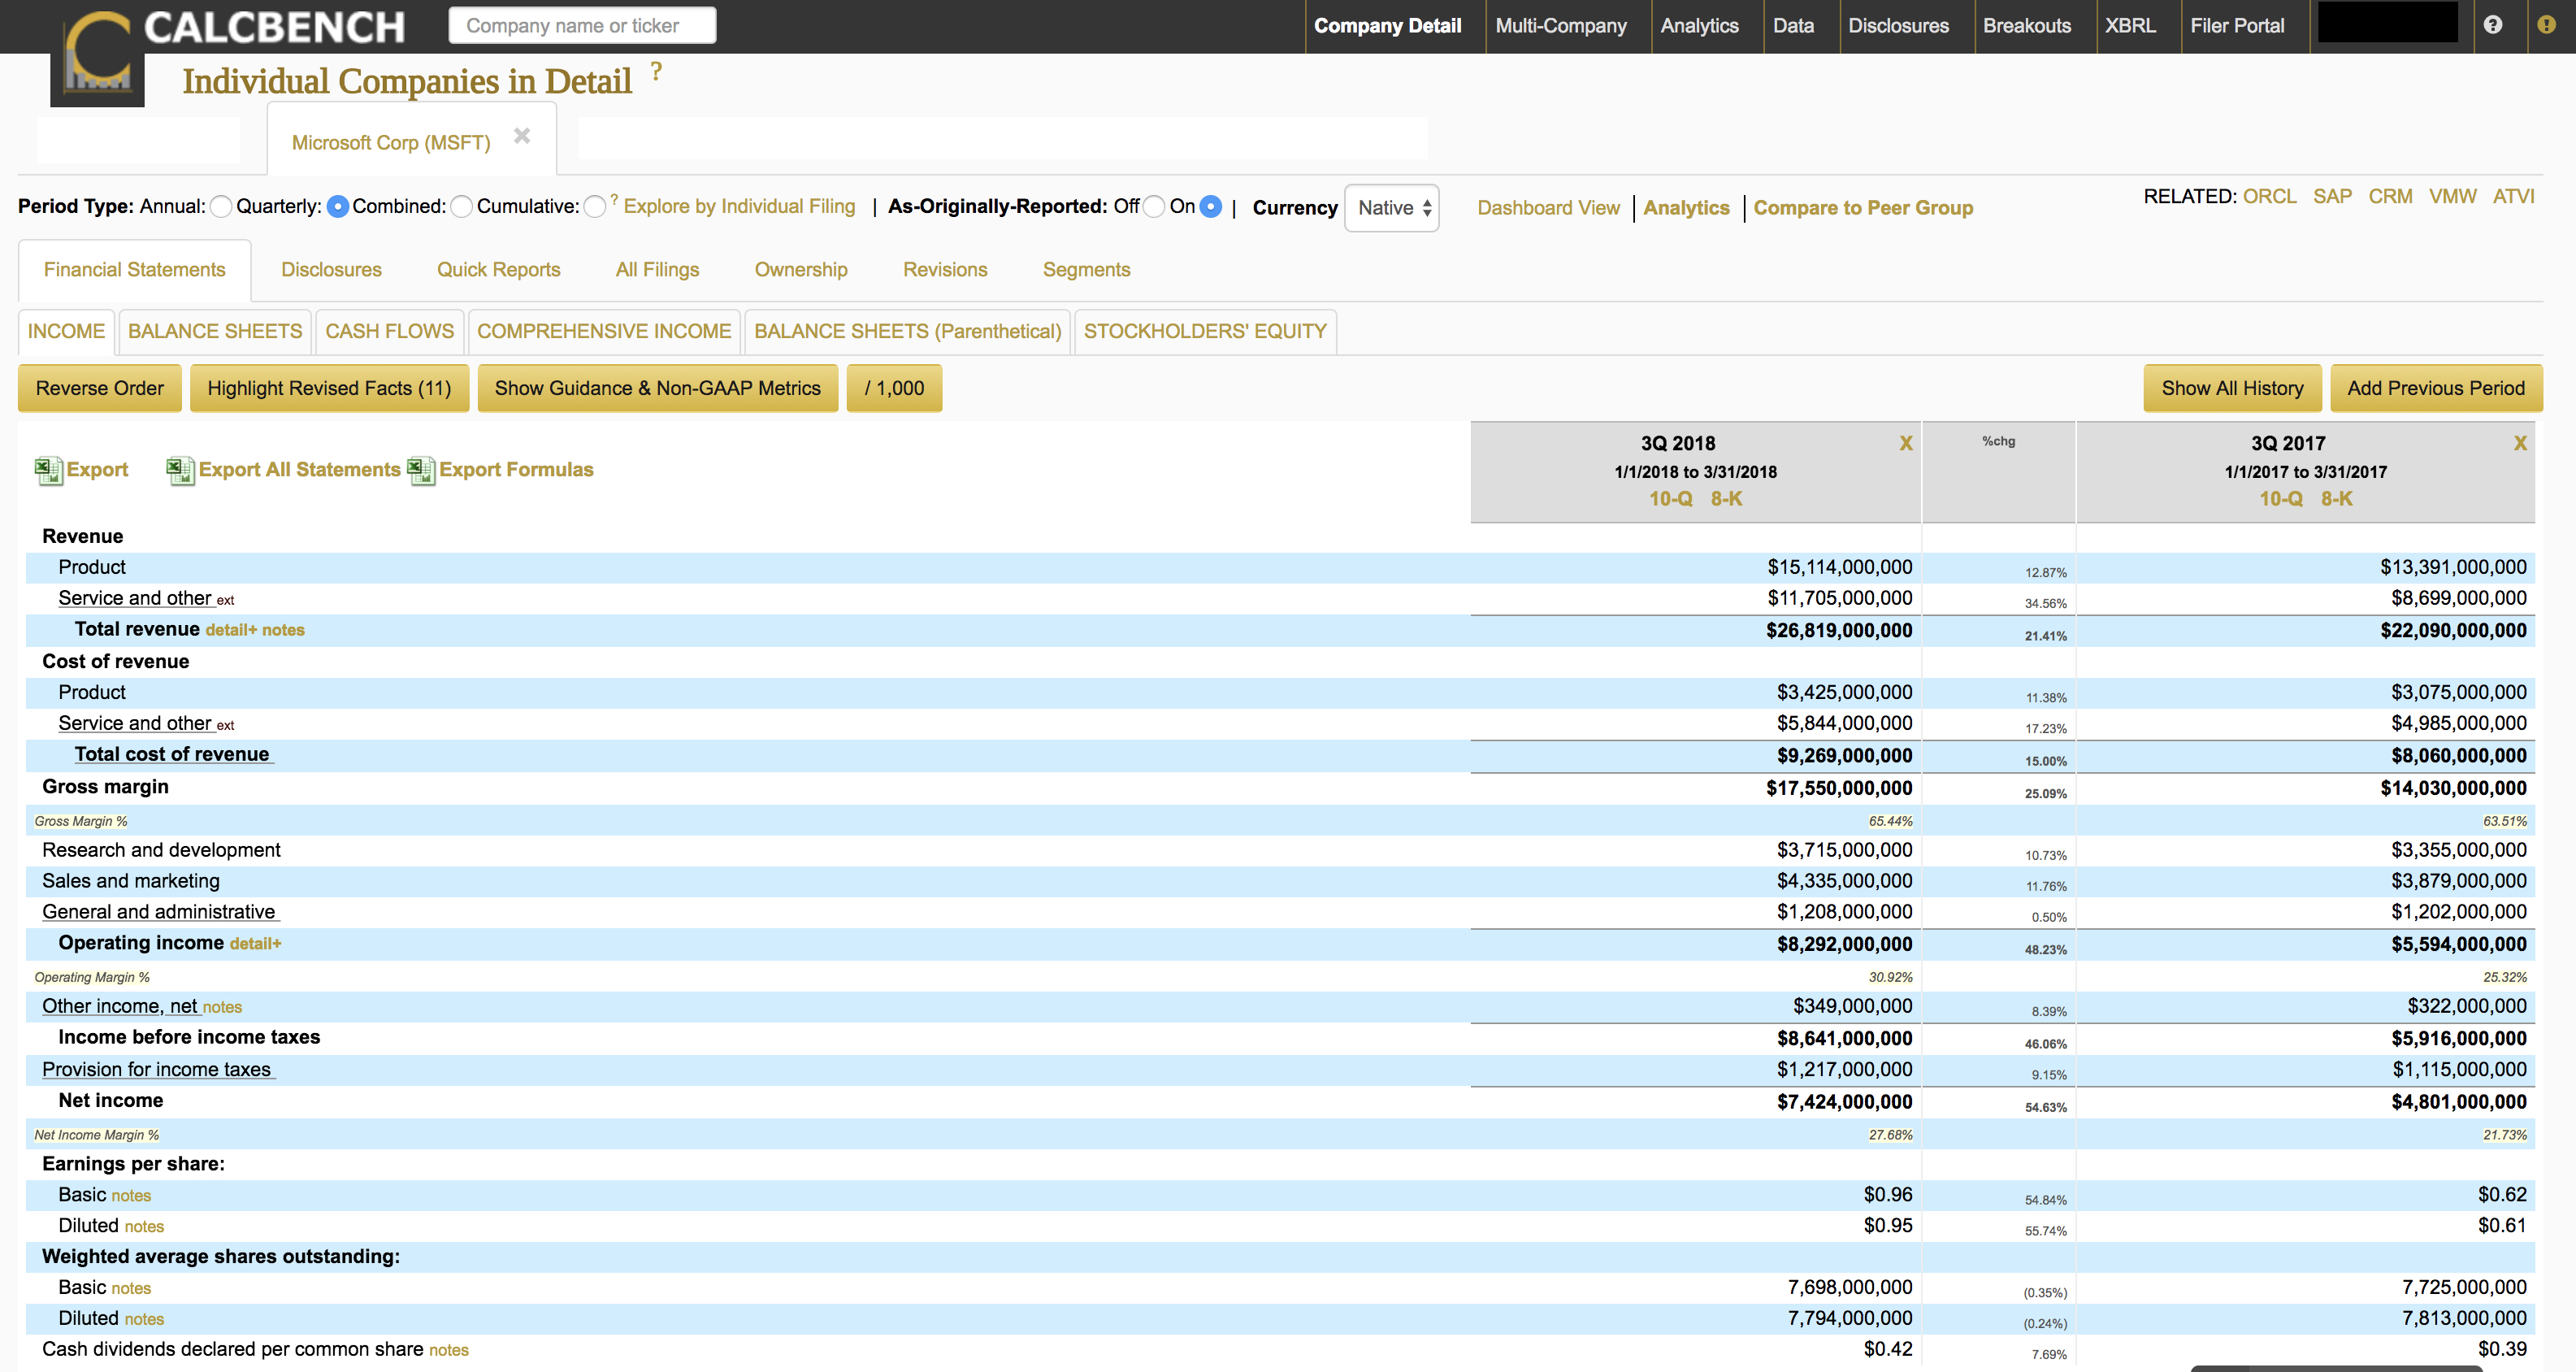
An analyst also may want to know how the numbers have been affected. Consider the Microsoft’s Income Statement from the first quarter of calendar year 2018 (fiscal 3Q for Microsoft) and compare it with the originally filed statement from the first quarter of calendar year 2017 (Figure 3).
Take note that product revenue is $13.391 billion for the 2017 period, whereas service revenue is $8.699 billion. Microsoft originally filed these numbers in April 2017.
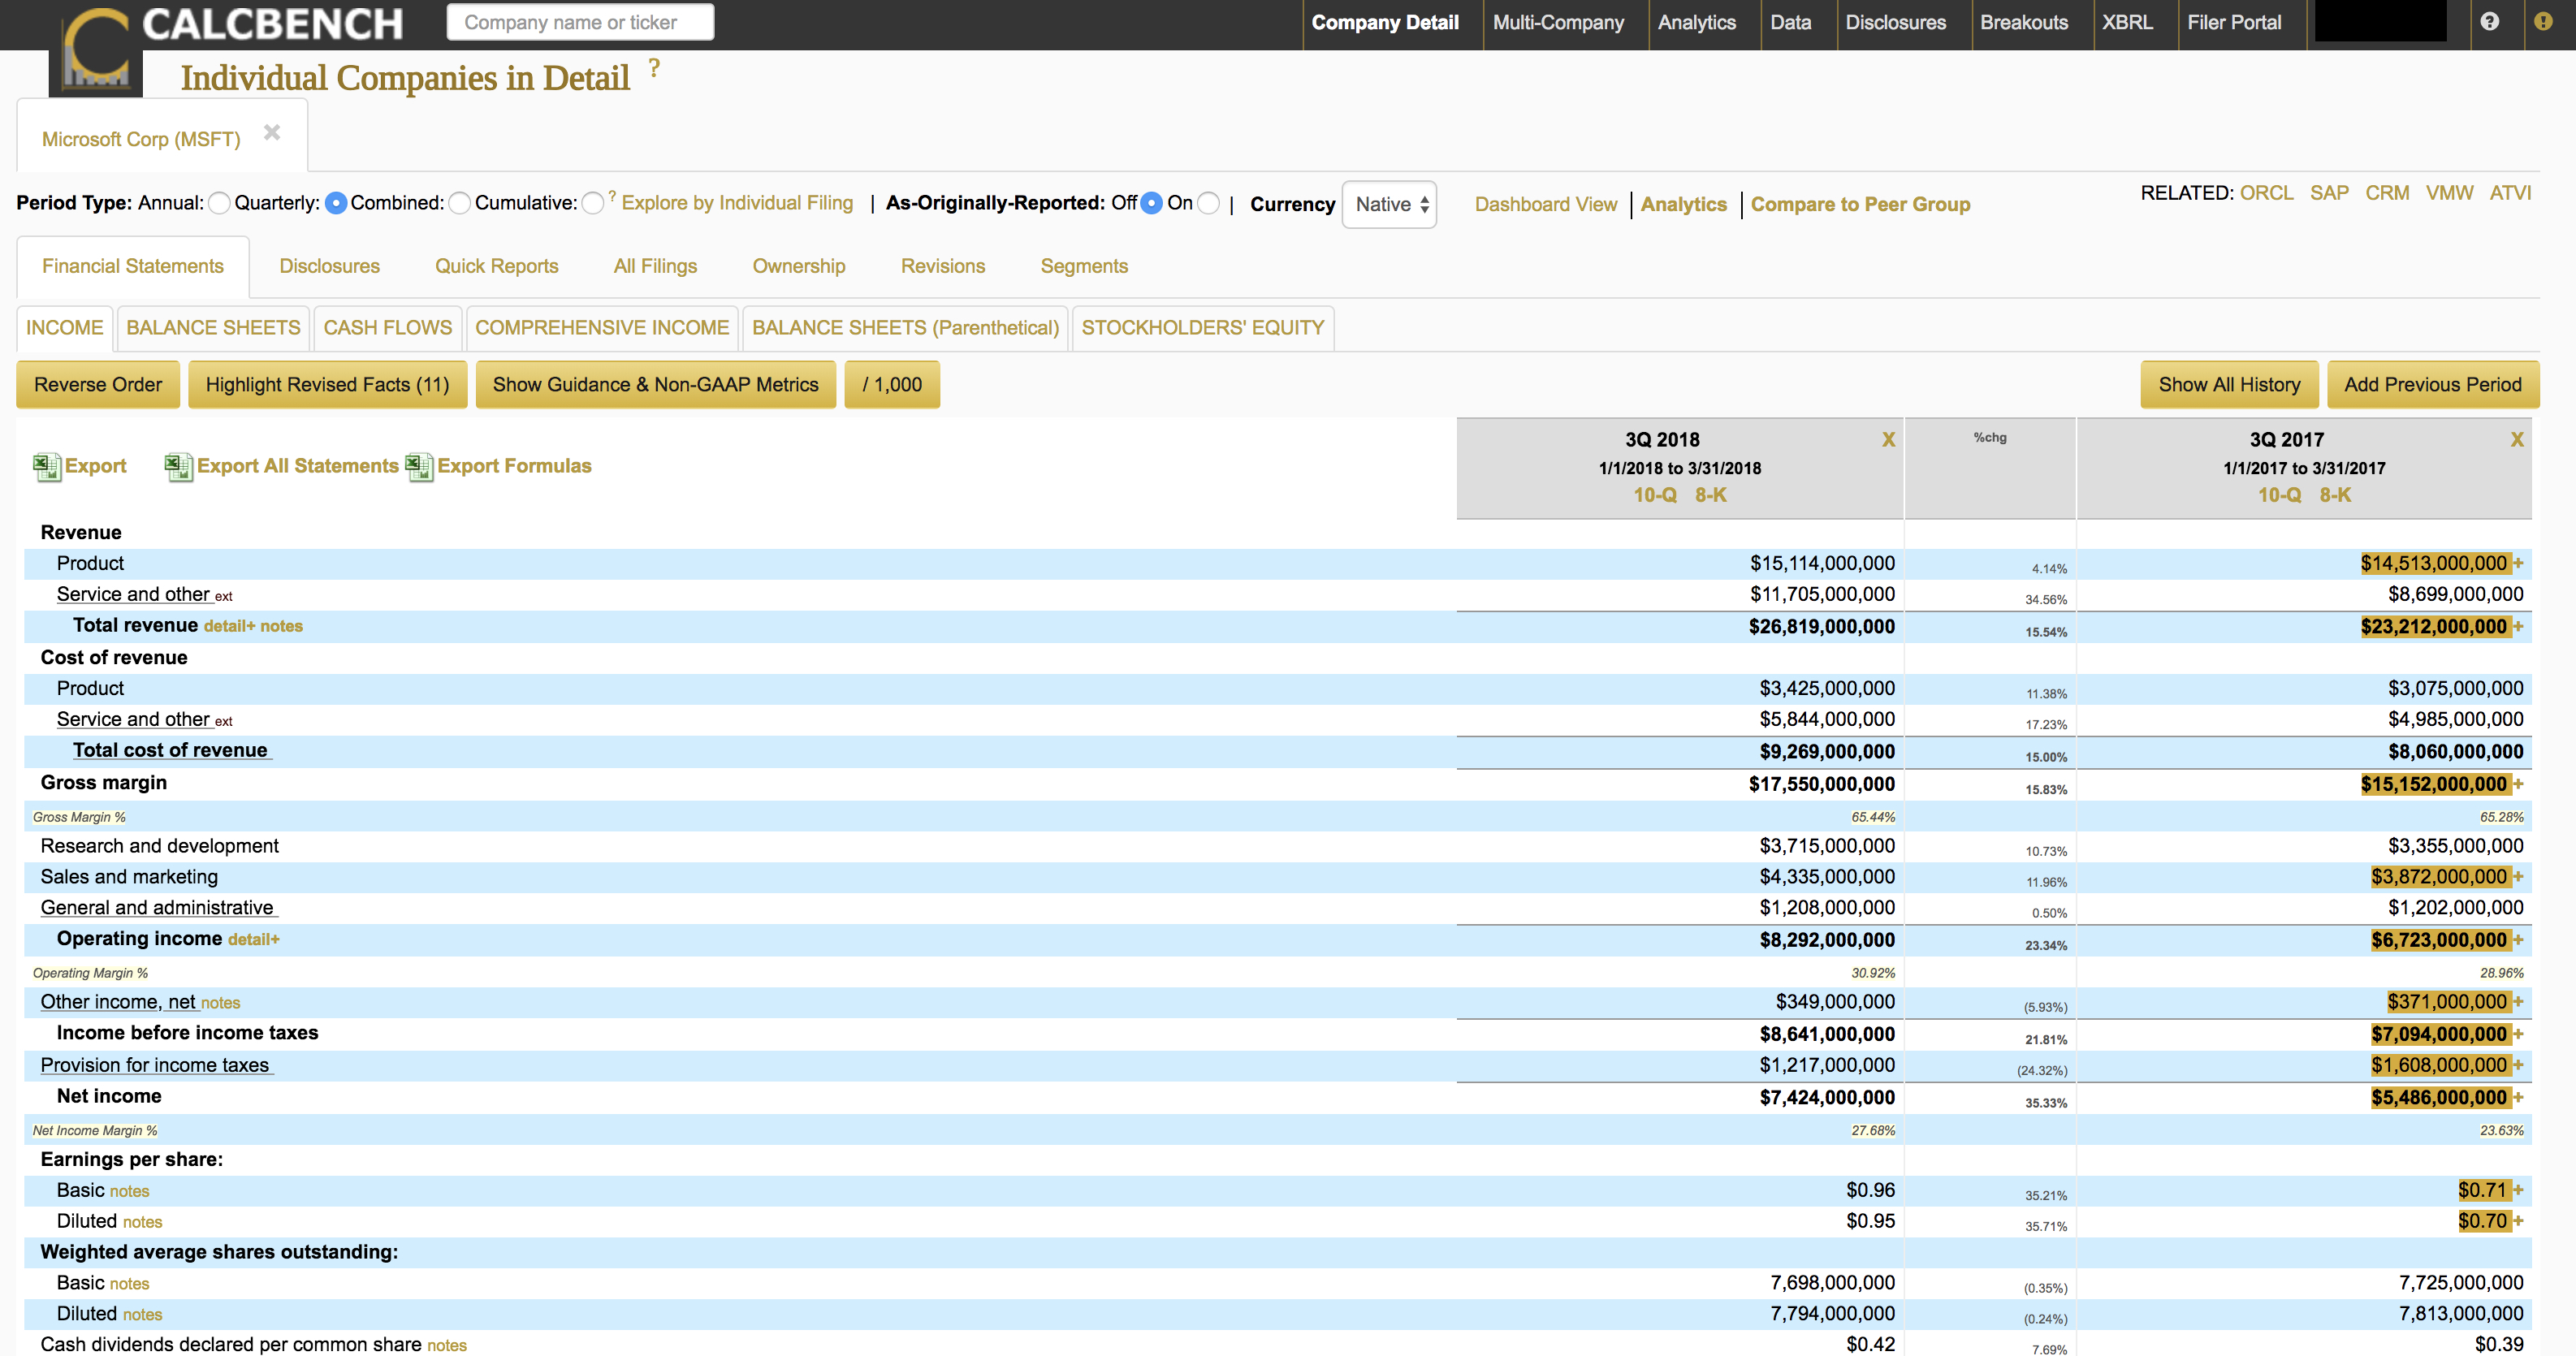
Next look at the revised numbers under the newly adopted revenue recognition rules (Figure 4). Notice that the Microsoft product revenue from one year ago is now $14.513 billion—a difference of $1.122 billion. The impact to diluted EPS was roughly $0.09 per share.
Disclosures
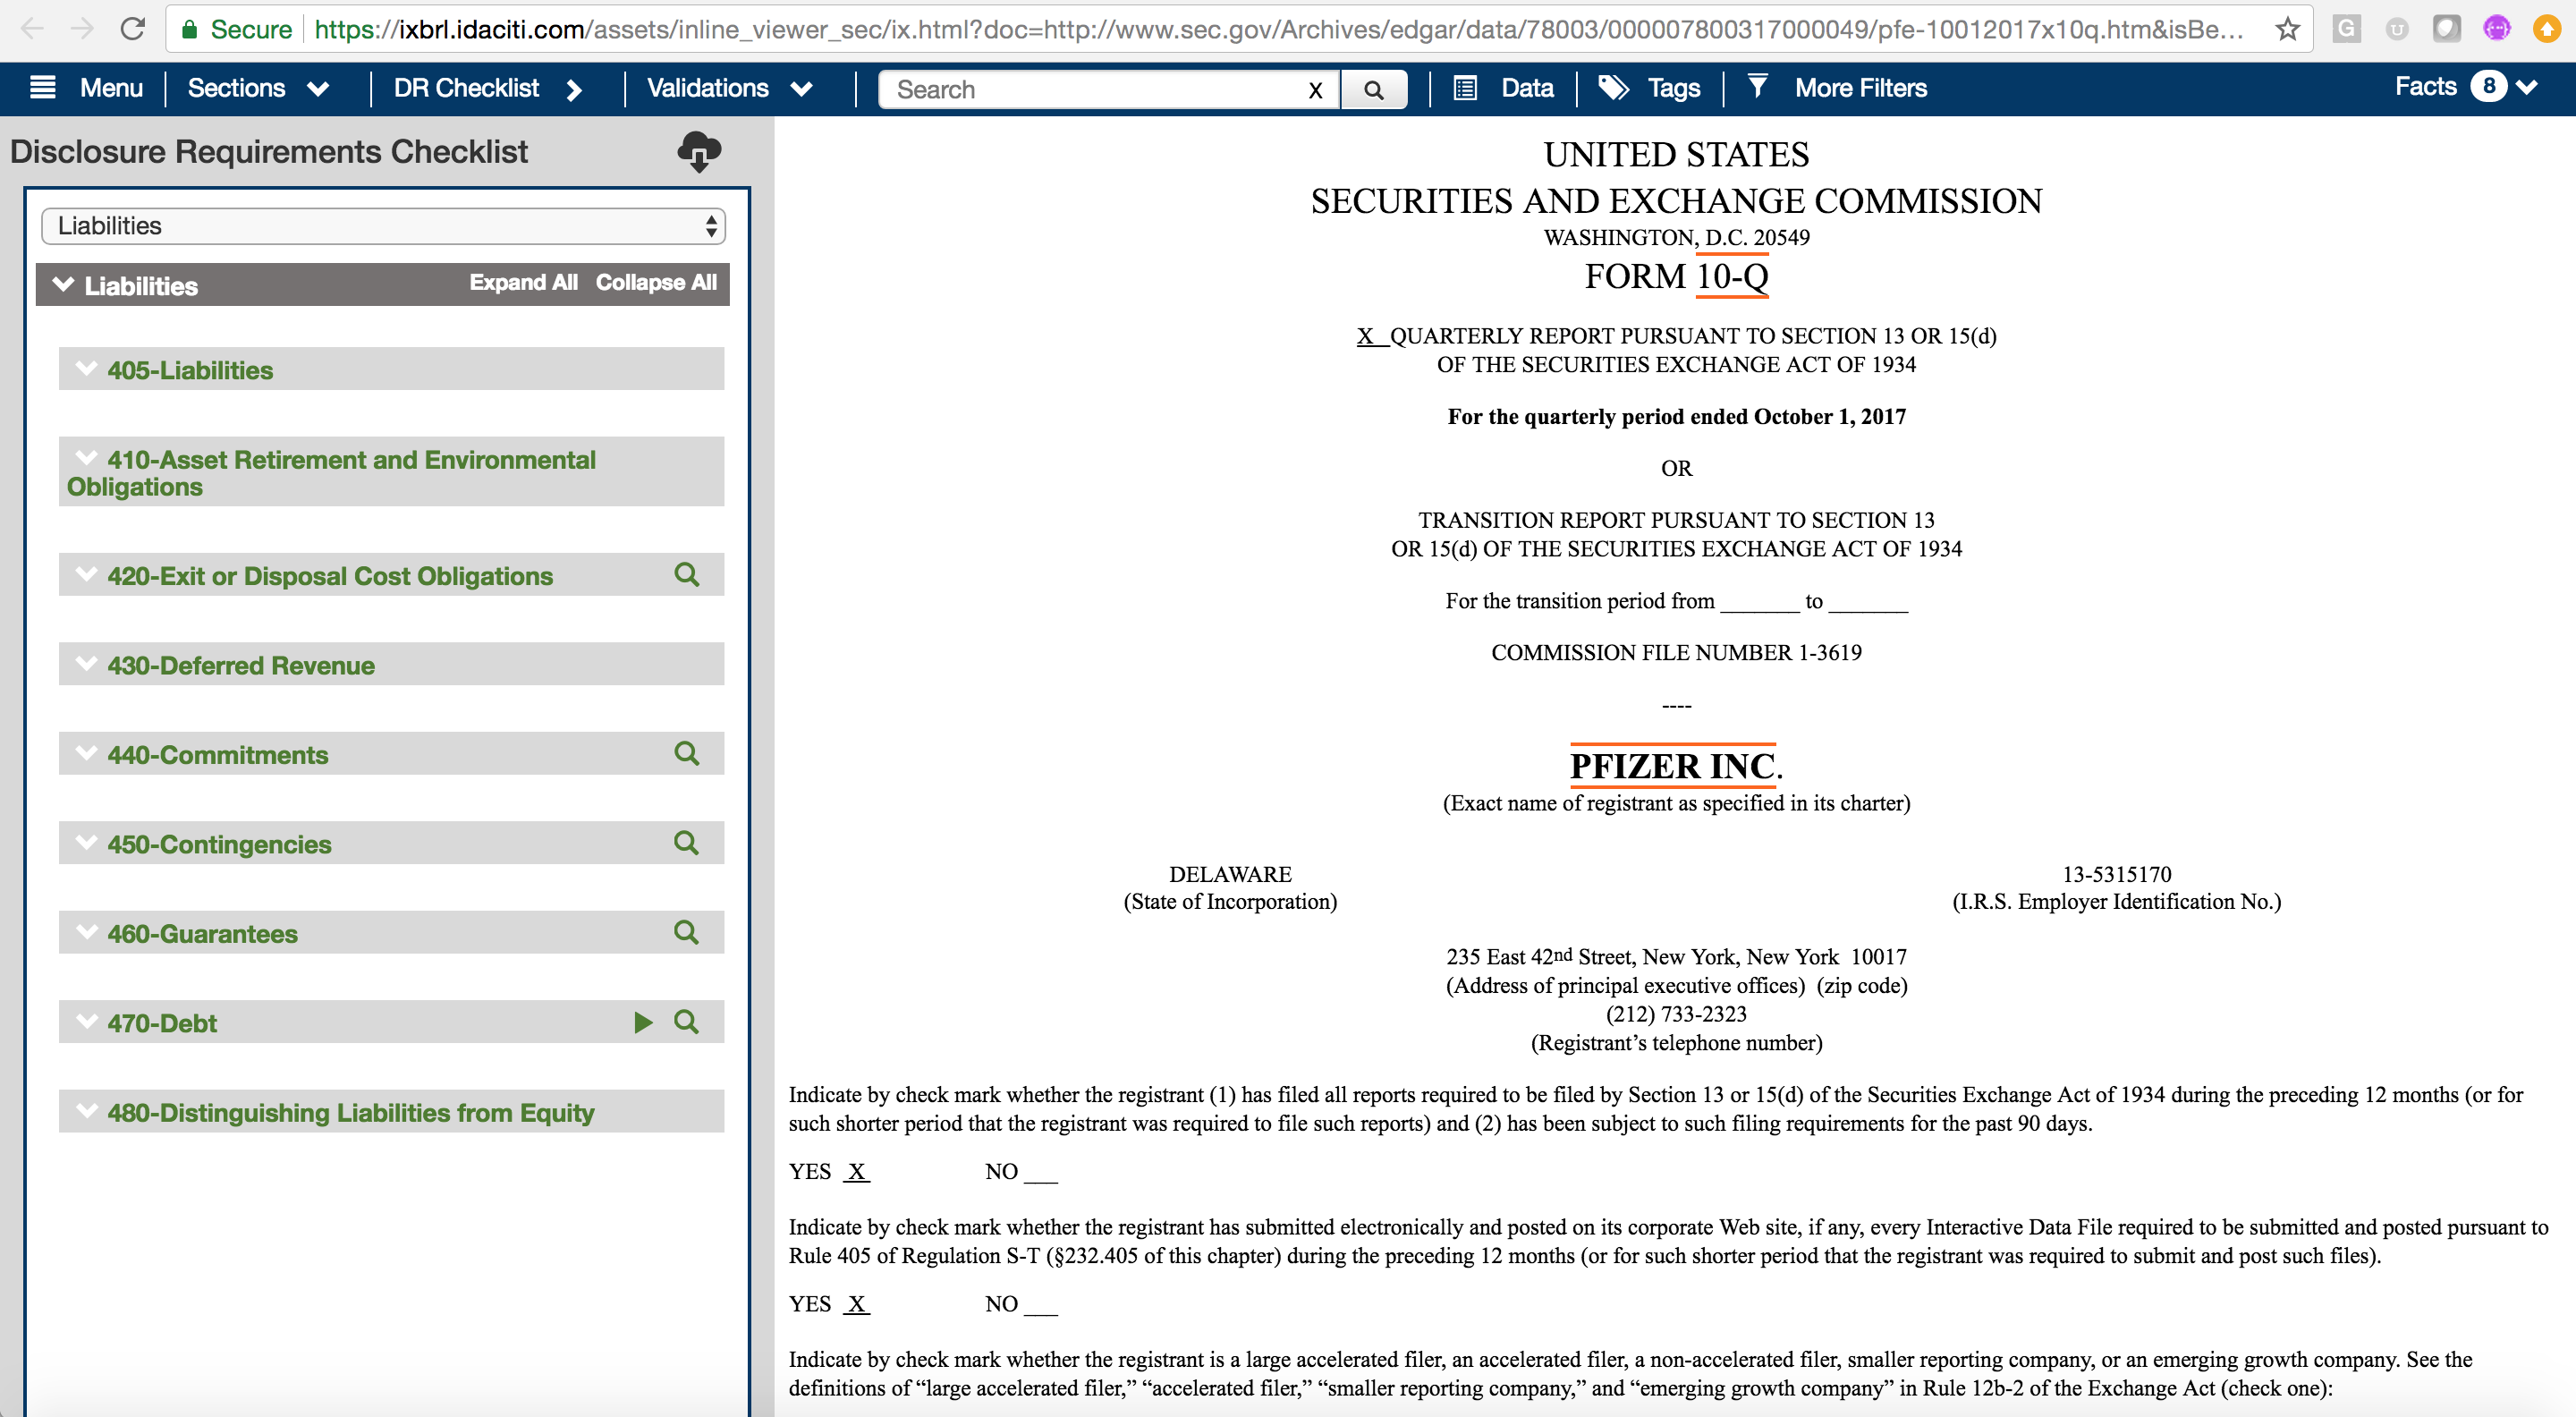
On the idaciti platform, investors can use the Disclosure Research checklist to identify where a company may disclose certain topic areas. For example, using the Disclosure Research checklist, see Pfizer’s 2017 Q3 filings and look at the list of Notes to the Financials. Note the absence of a debt footnote (Figure 5).
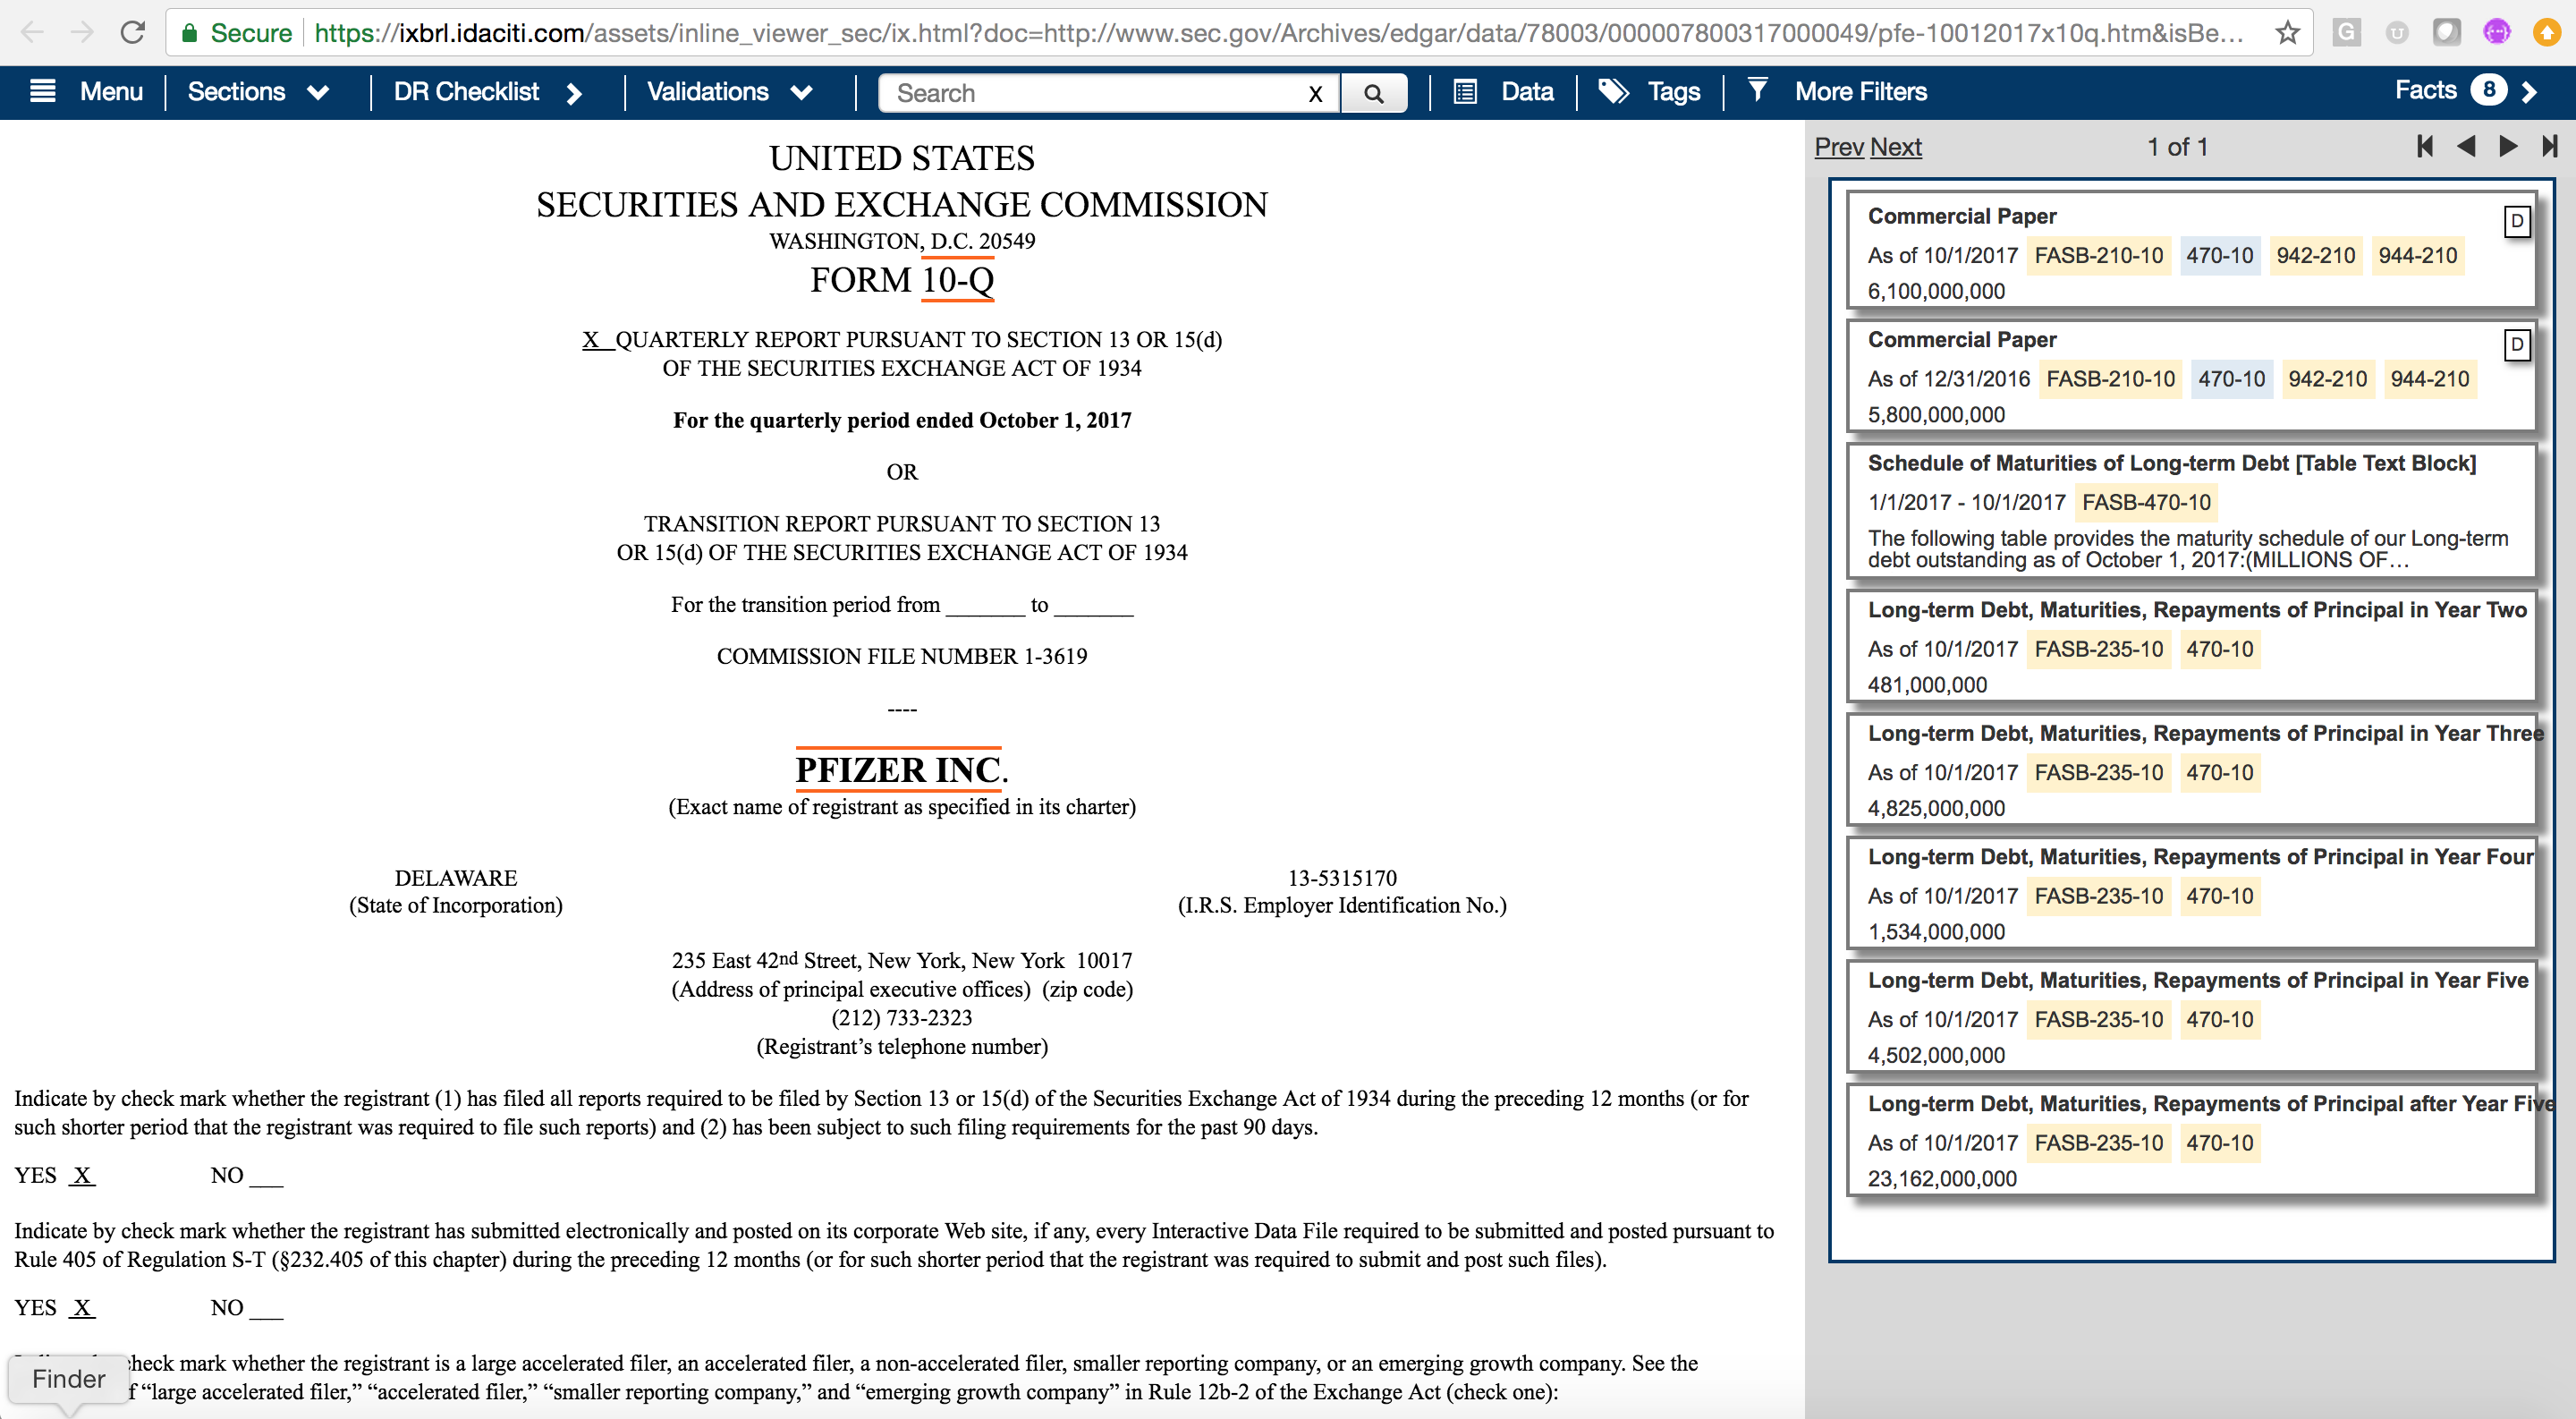
Instead, to identify what Pfizer disclosed about its debt, conduct a search for elements that refer to the debt codification. This reveals that Pfizer does tag facts in the filing using elements that refer to the FASB codification reference for Topic 470–Debt. The search brings up all elements that refer to Debt (Figure 6).
Clicking on an element jumps directly to its location within the filing. Interestingly, Pfizer disclosed this Debt information within Footnote 7, Financial Instruments.
Value of Structured Data: Case Studies
The case studies that follow illustrate XBRL’s use in accounting and financial reporting and the rationale behind its adoption as well as the ways in which XBRL is employed in the financial sector.
Unremitted Foreign Earnings
Until recently “unremitted (untaxed) foreign earnings,” which had significant implications for corporate earnings, were of great interest to analysts.5 To remain “untaxed,” these amounts had to be indefinitely reinvested outside the United States and therefore were not available for redistribution to shareholders. It also was important for investors to estimate how eliminating these tax benefits would have depressed earnings. For many investors, the data were difficult to analyze because of their placement in the company filings; often, they were embedded in the Notes to the Financials.
Accounting Observer, a research newsletter that analyzes the impact of accounting issues on investments, has been following this issue since 2005 by reviewing data for companies in the S&P 500 Index. To conduct this analysis required extracting seven data points from 500 separate paper-based filings by pulling the filing online, visually scanning each document, and keying the data into a spreadsheet. Two research analysts spent about one week pulling the data (i.e., about 80 hours).
With XBRL, a single individual could perform this same analysis in one day, using an online tool to pull seven concepts defined in the US GAAP Taxonomy. The result is that one individual can extract, review, and validate, as well as make adjustments to, the data in one day—a savings of 72 person-hours in time and resources that could be better spent on valuable analysis. The availability of data standards means that regulators, investors, and others can conduct analyses more efficiently and at reduced cost.6
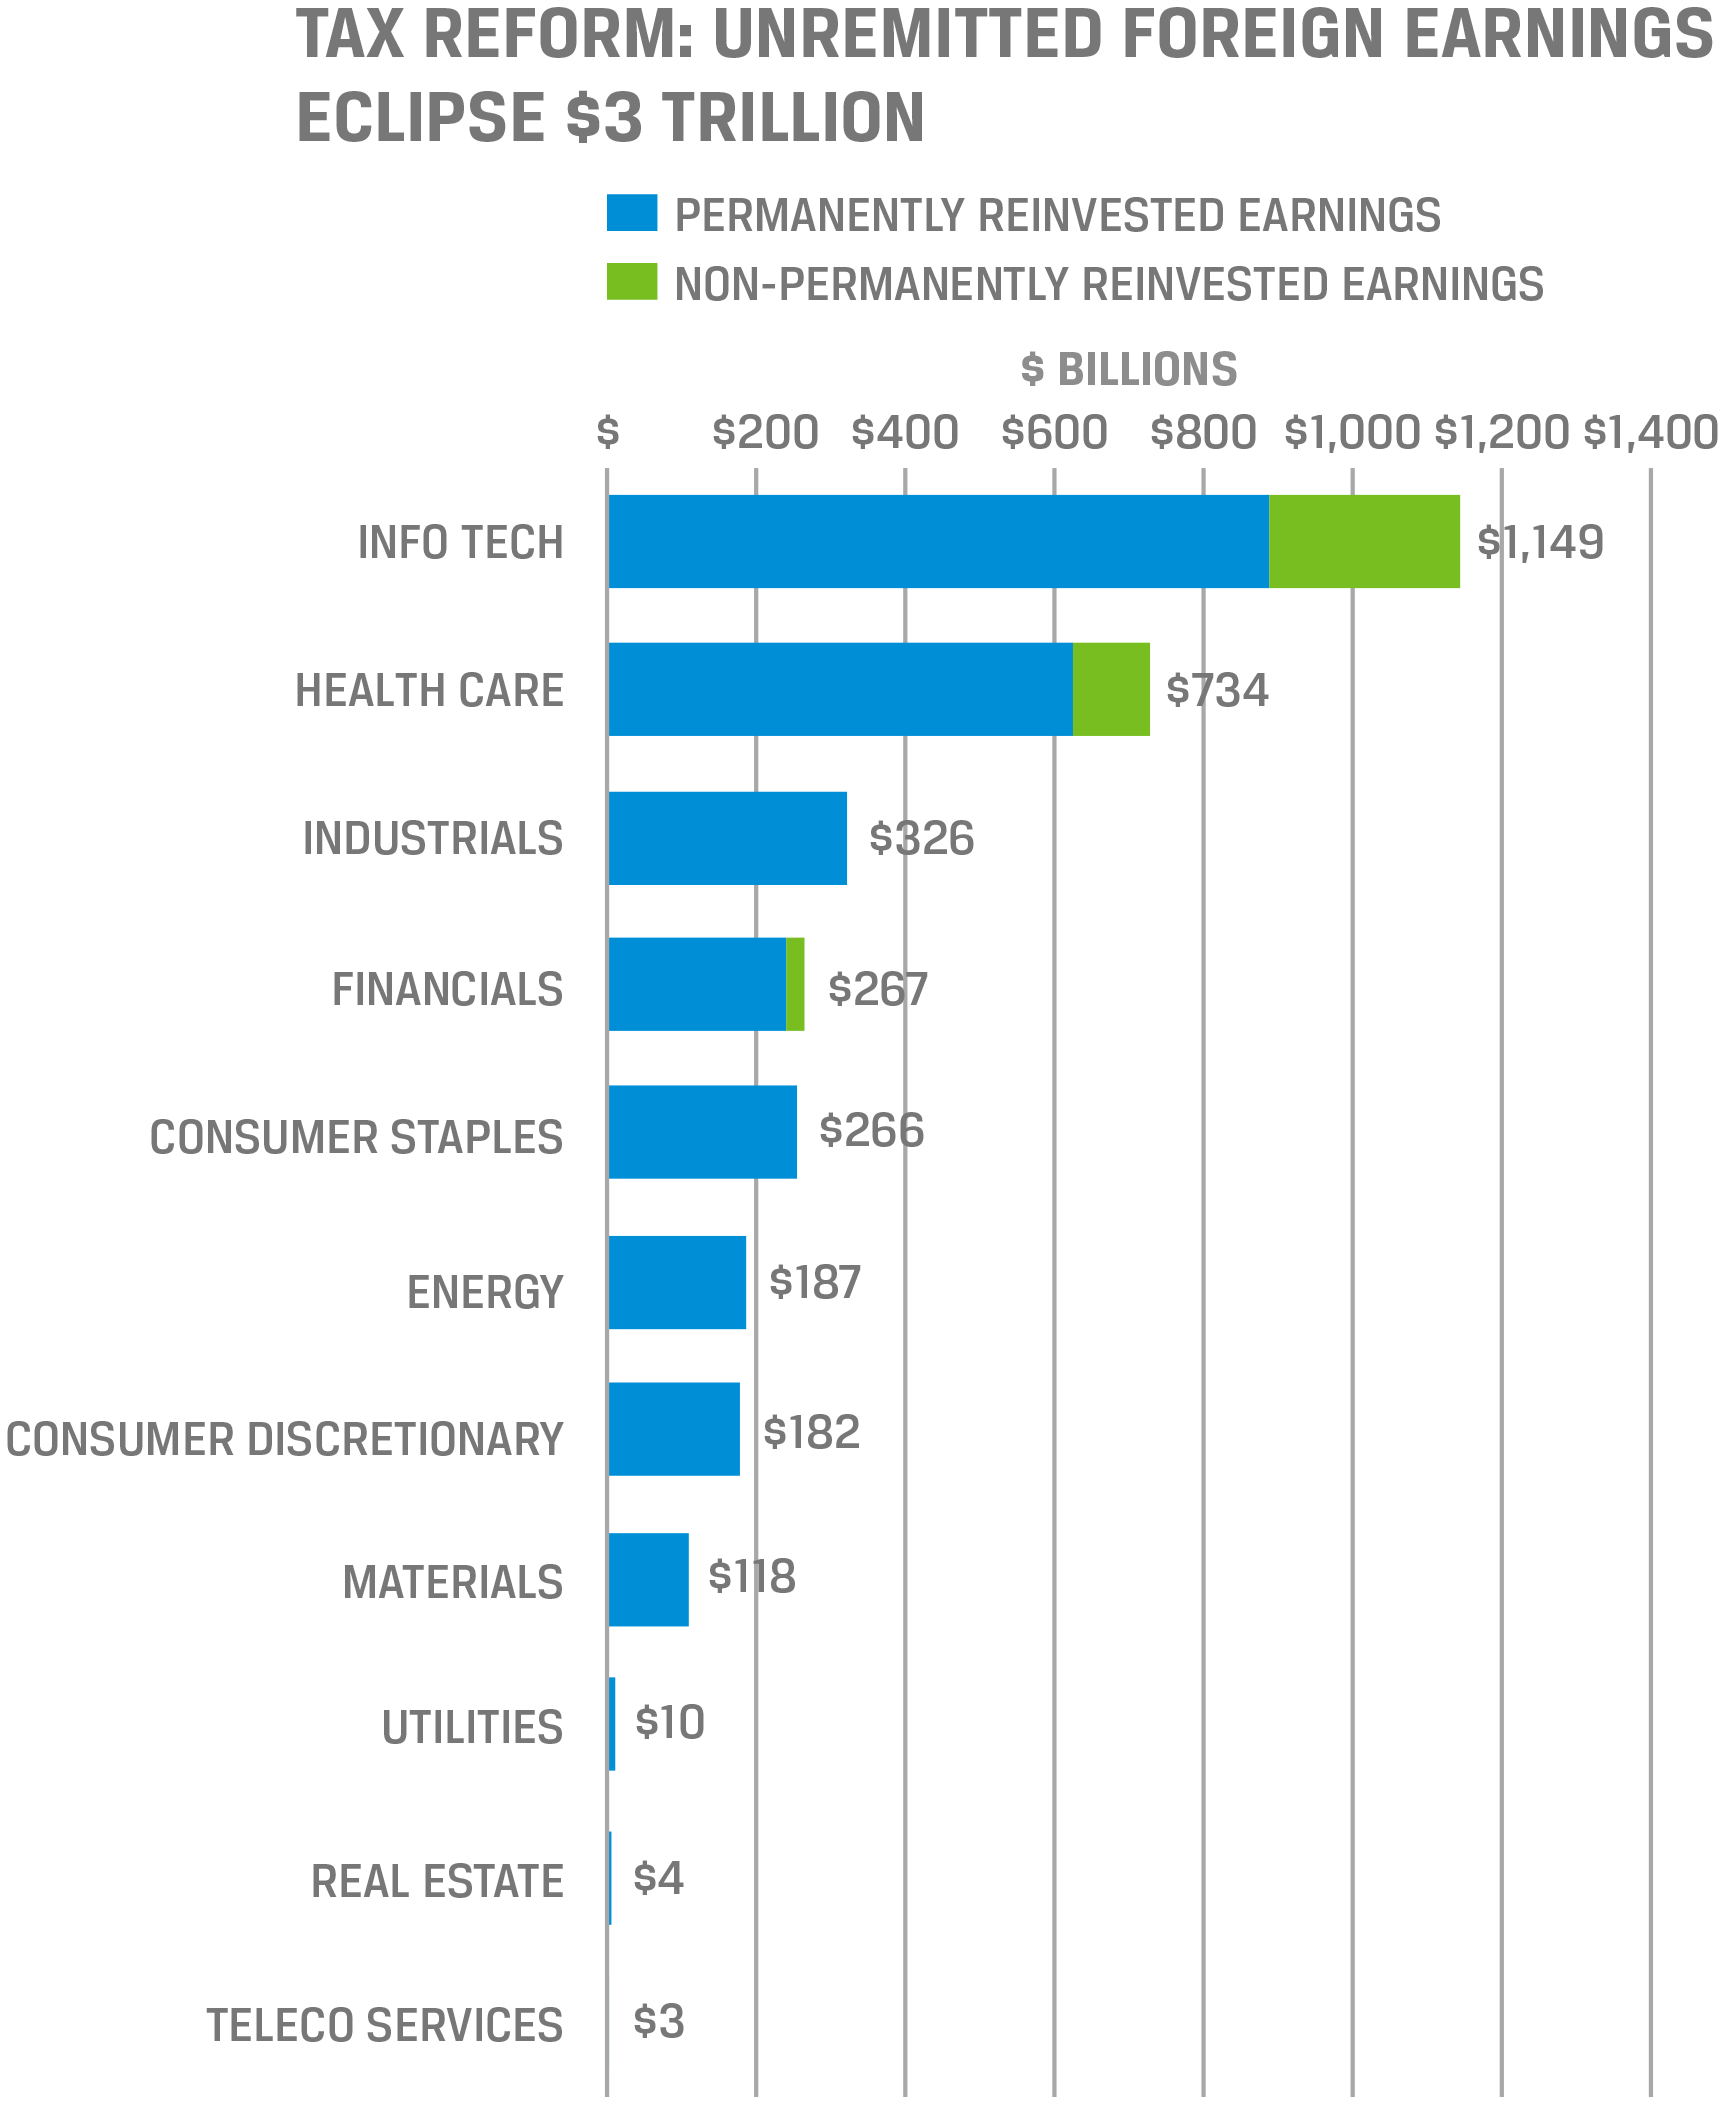
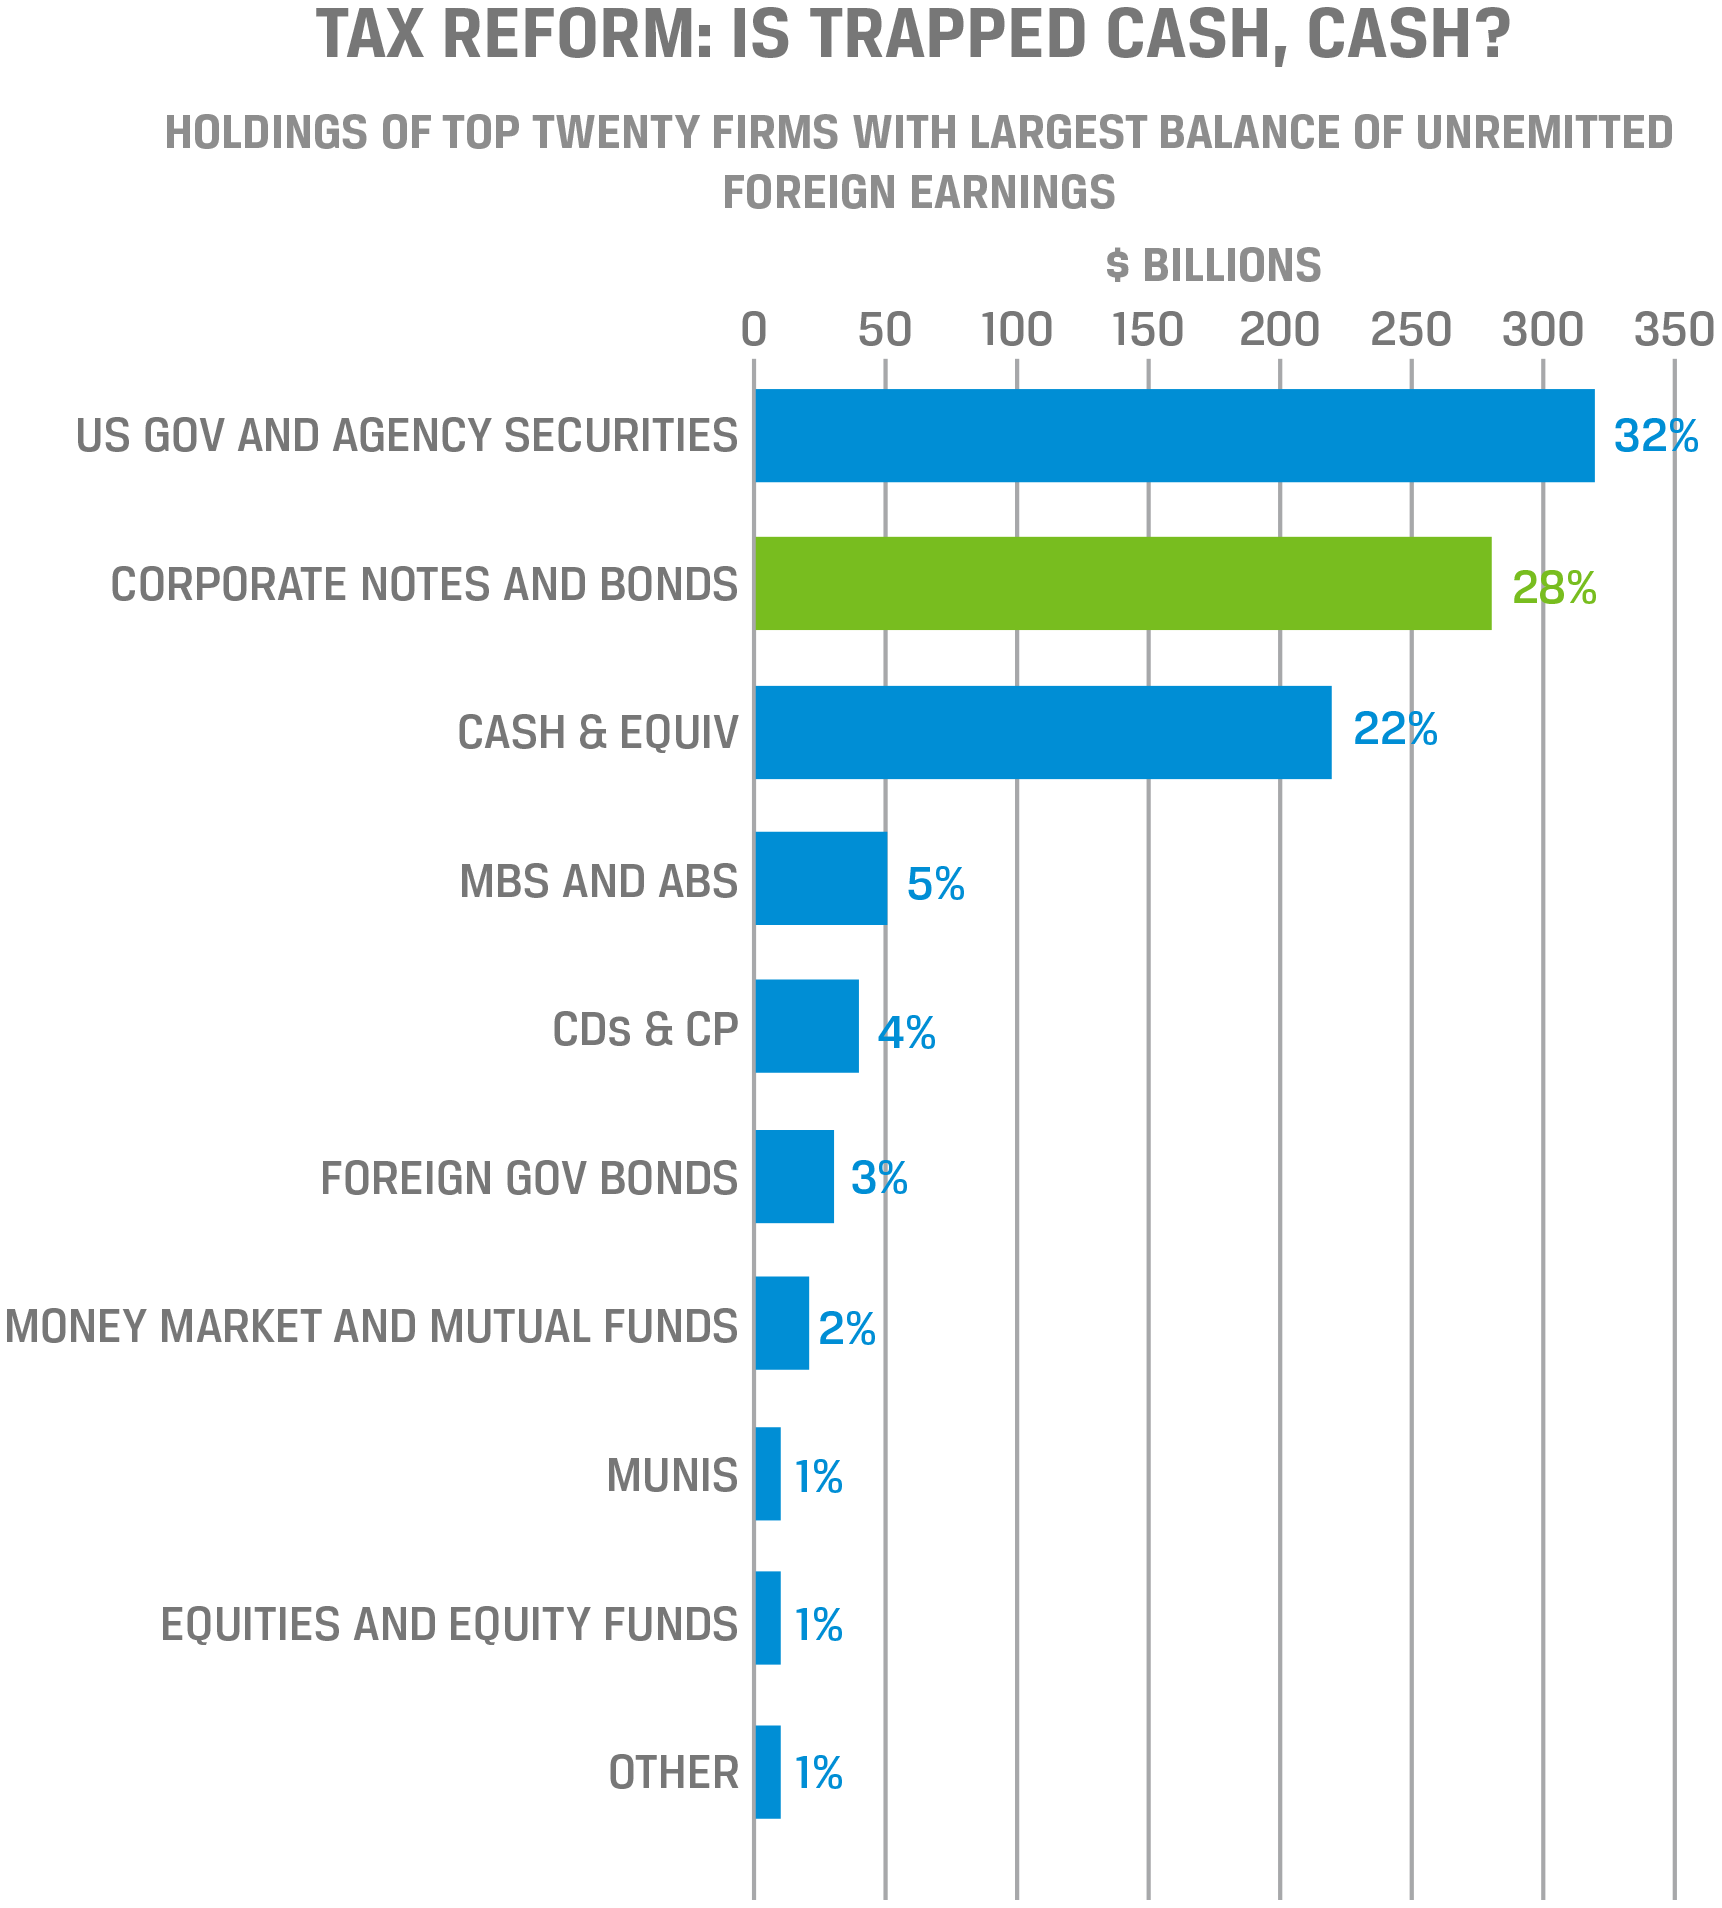
At the CFA Institute 2017 Investor Forum, Todd Castagno, executive director of Morgan Stanley, presented examples illustrating that the process of collecting these data can be automated and then categorized to determine unremitted foreign earnings by sector. Castagno showed that the volume of such earnings is more heavily concentrated among larger companies and that the bulk of it is held in US government securities (Figures 7 and 8).
Operating Leases
Operating leases do not appear on the balance sheet; however, under new FASB regulation ASU 2016- 02, companies will have to include these lease liabilities starting December 2018.
Calcbench conducted a study7 to determine the impact this change will have on firms’ balance sheets. It was able to access the impact of these change because the platform provides
- access to every lease footnote filed to the SEC,
- term structures of leasing arrangements,
- sector-level summaries, and
- changes in leasing obligations over time.
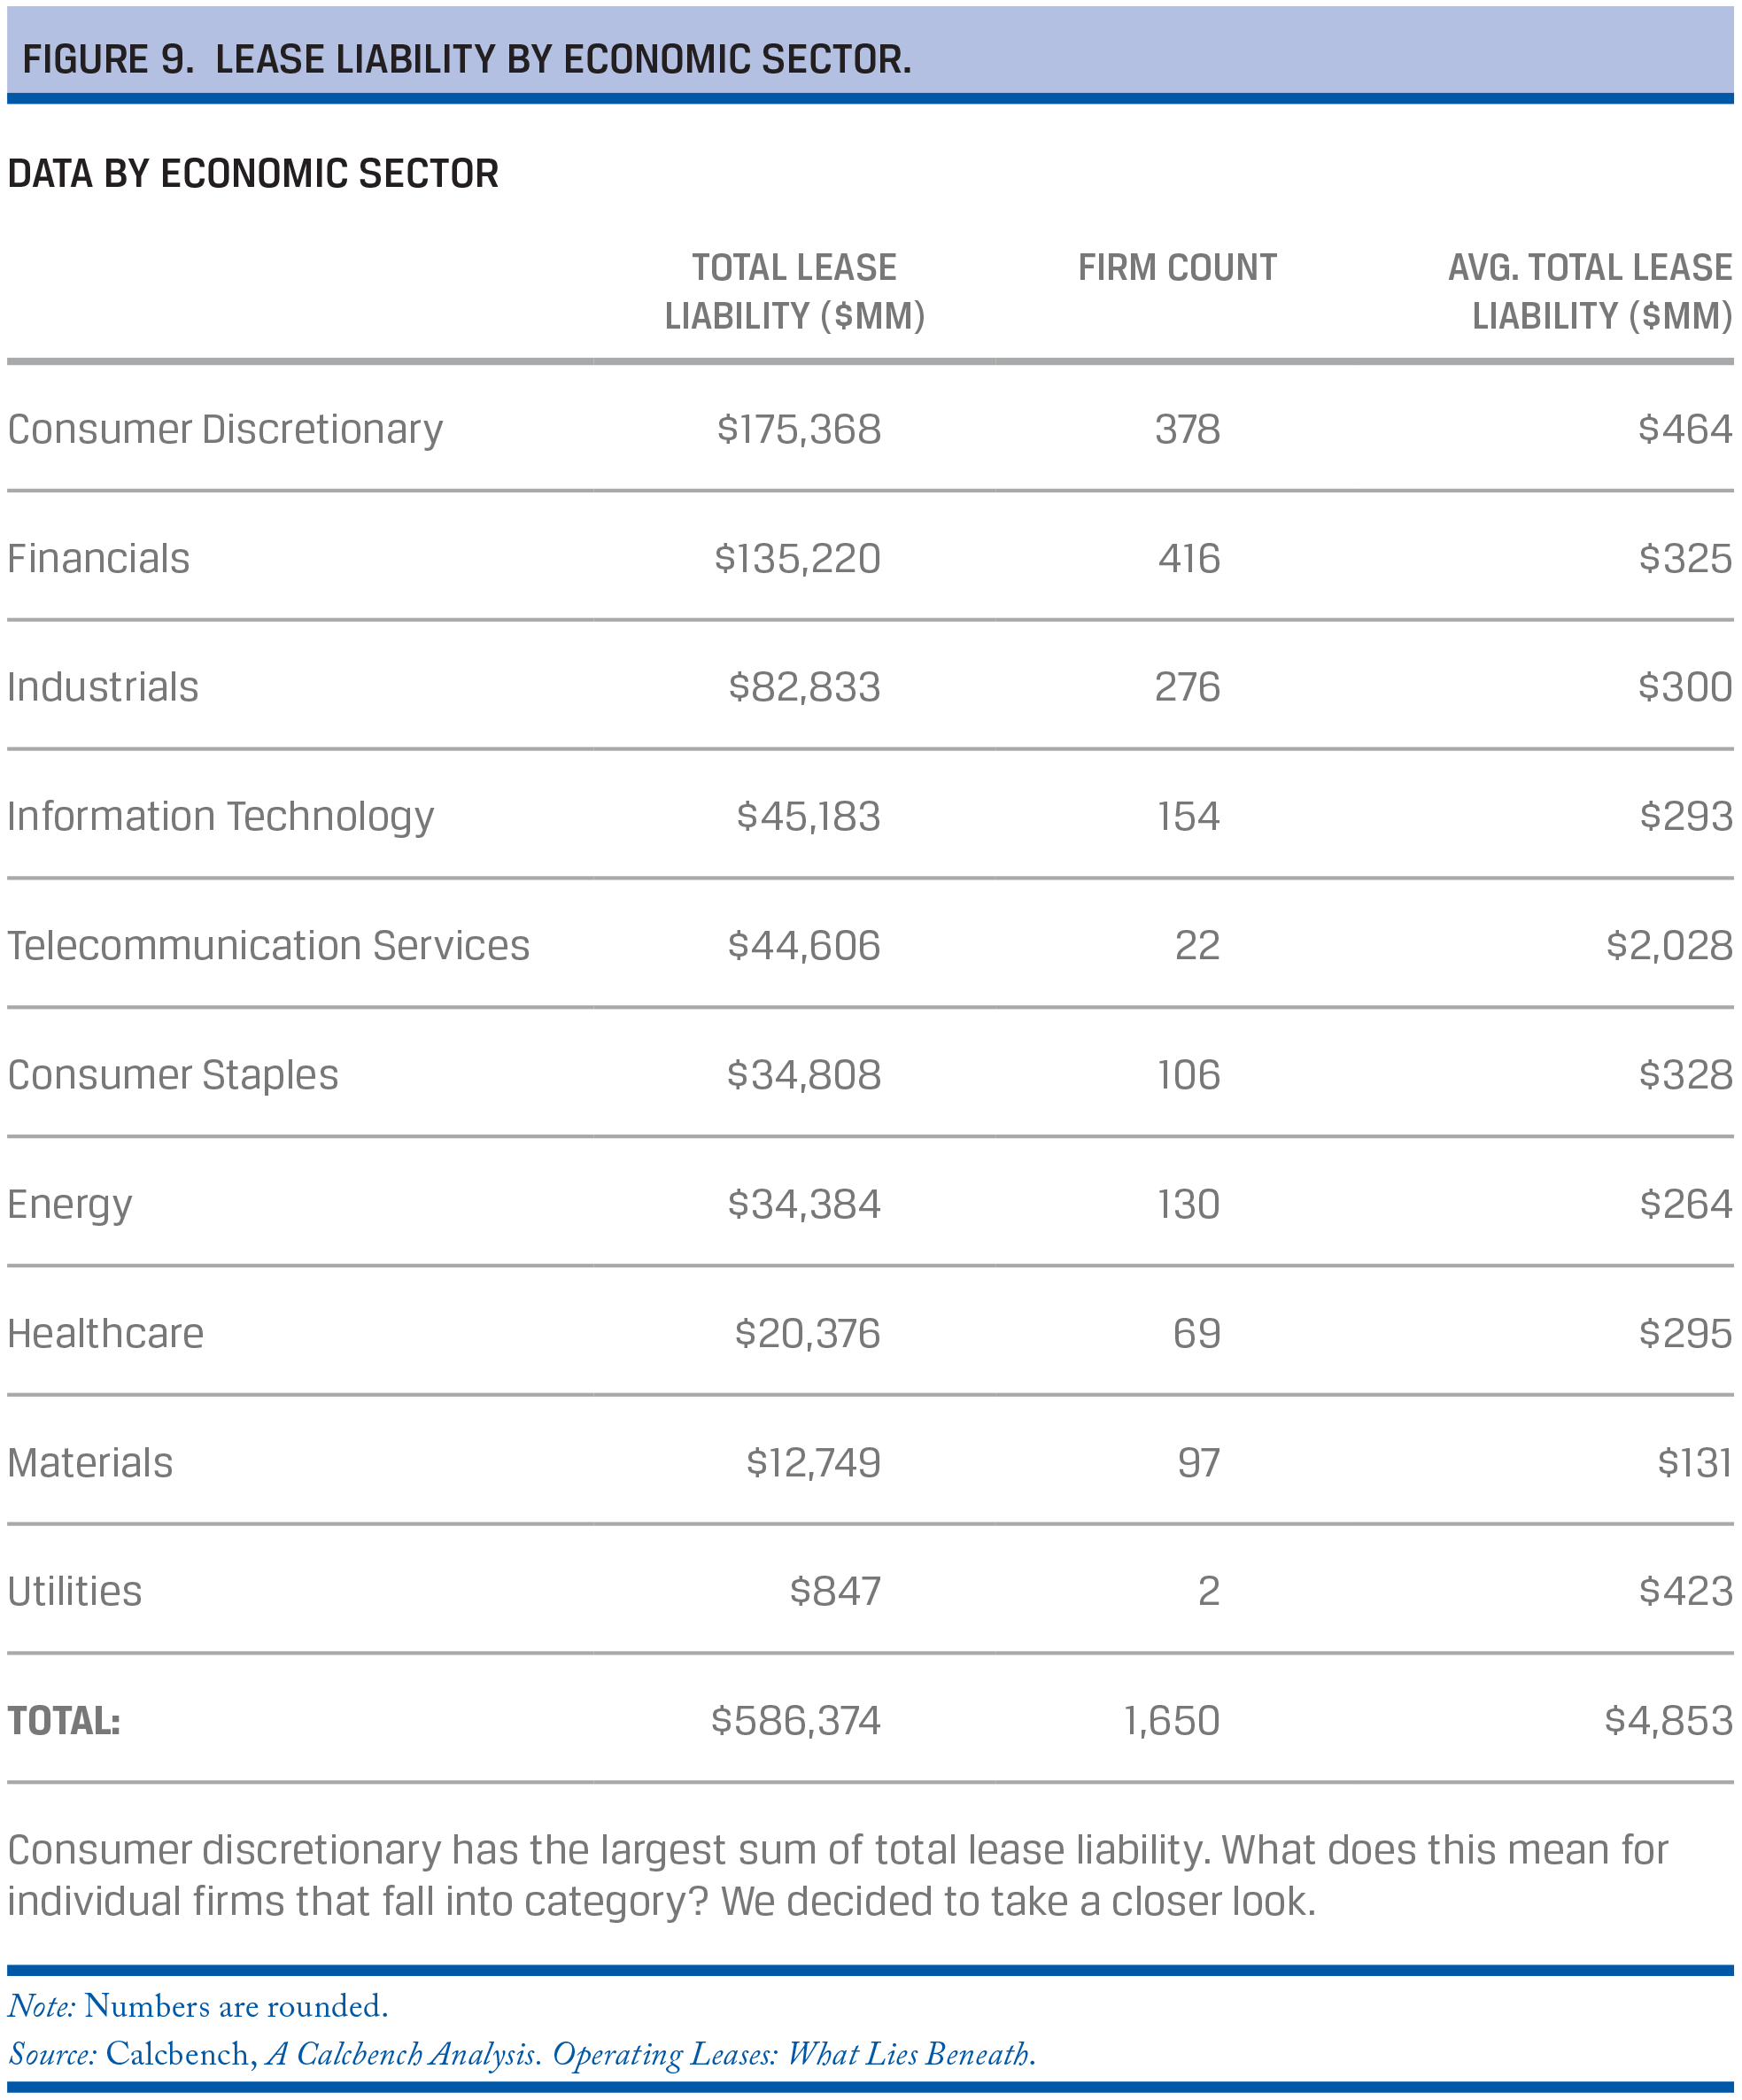
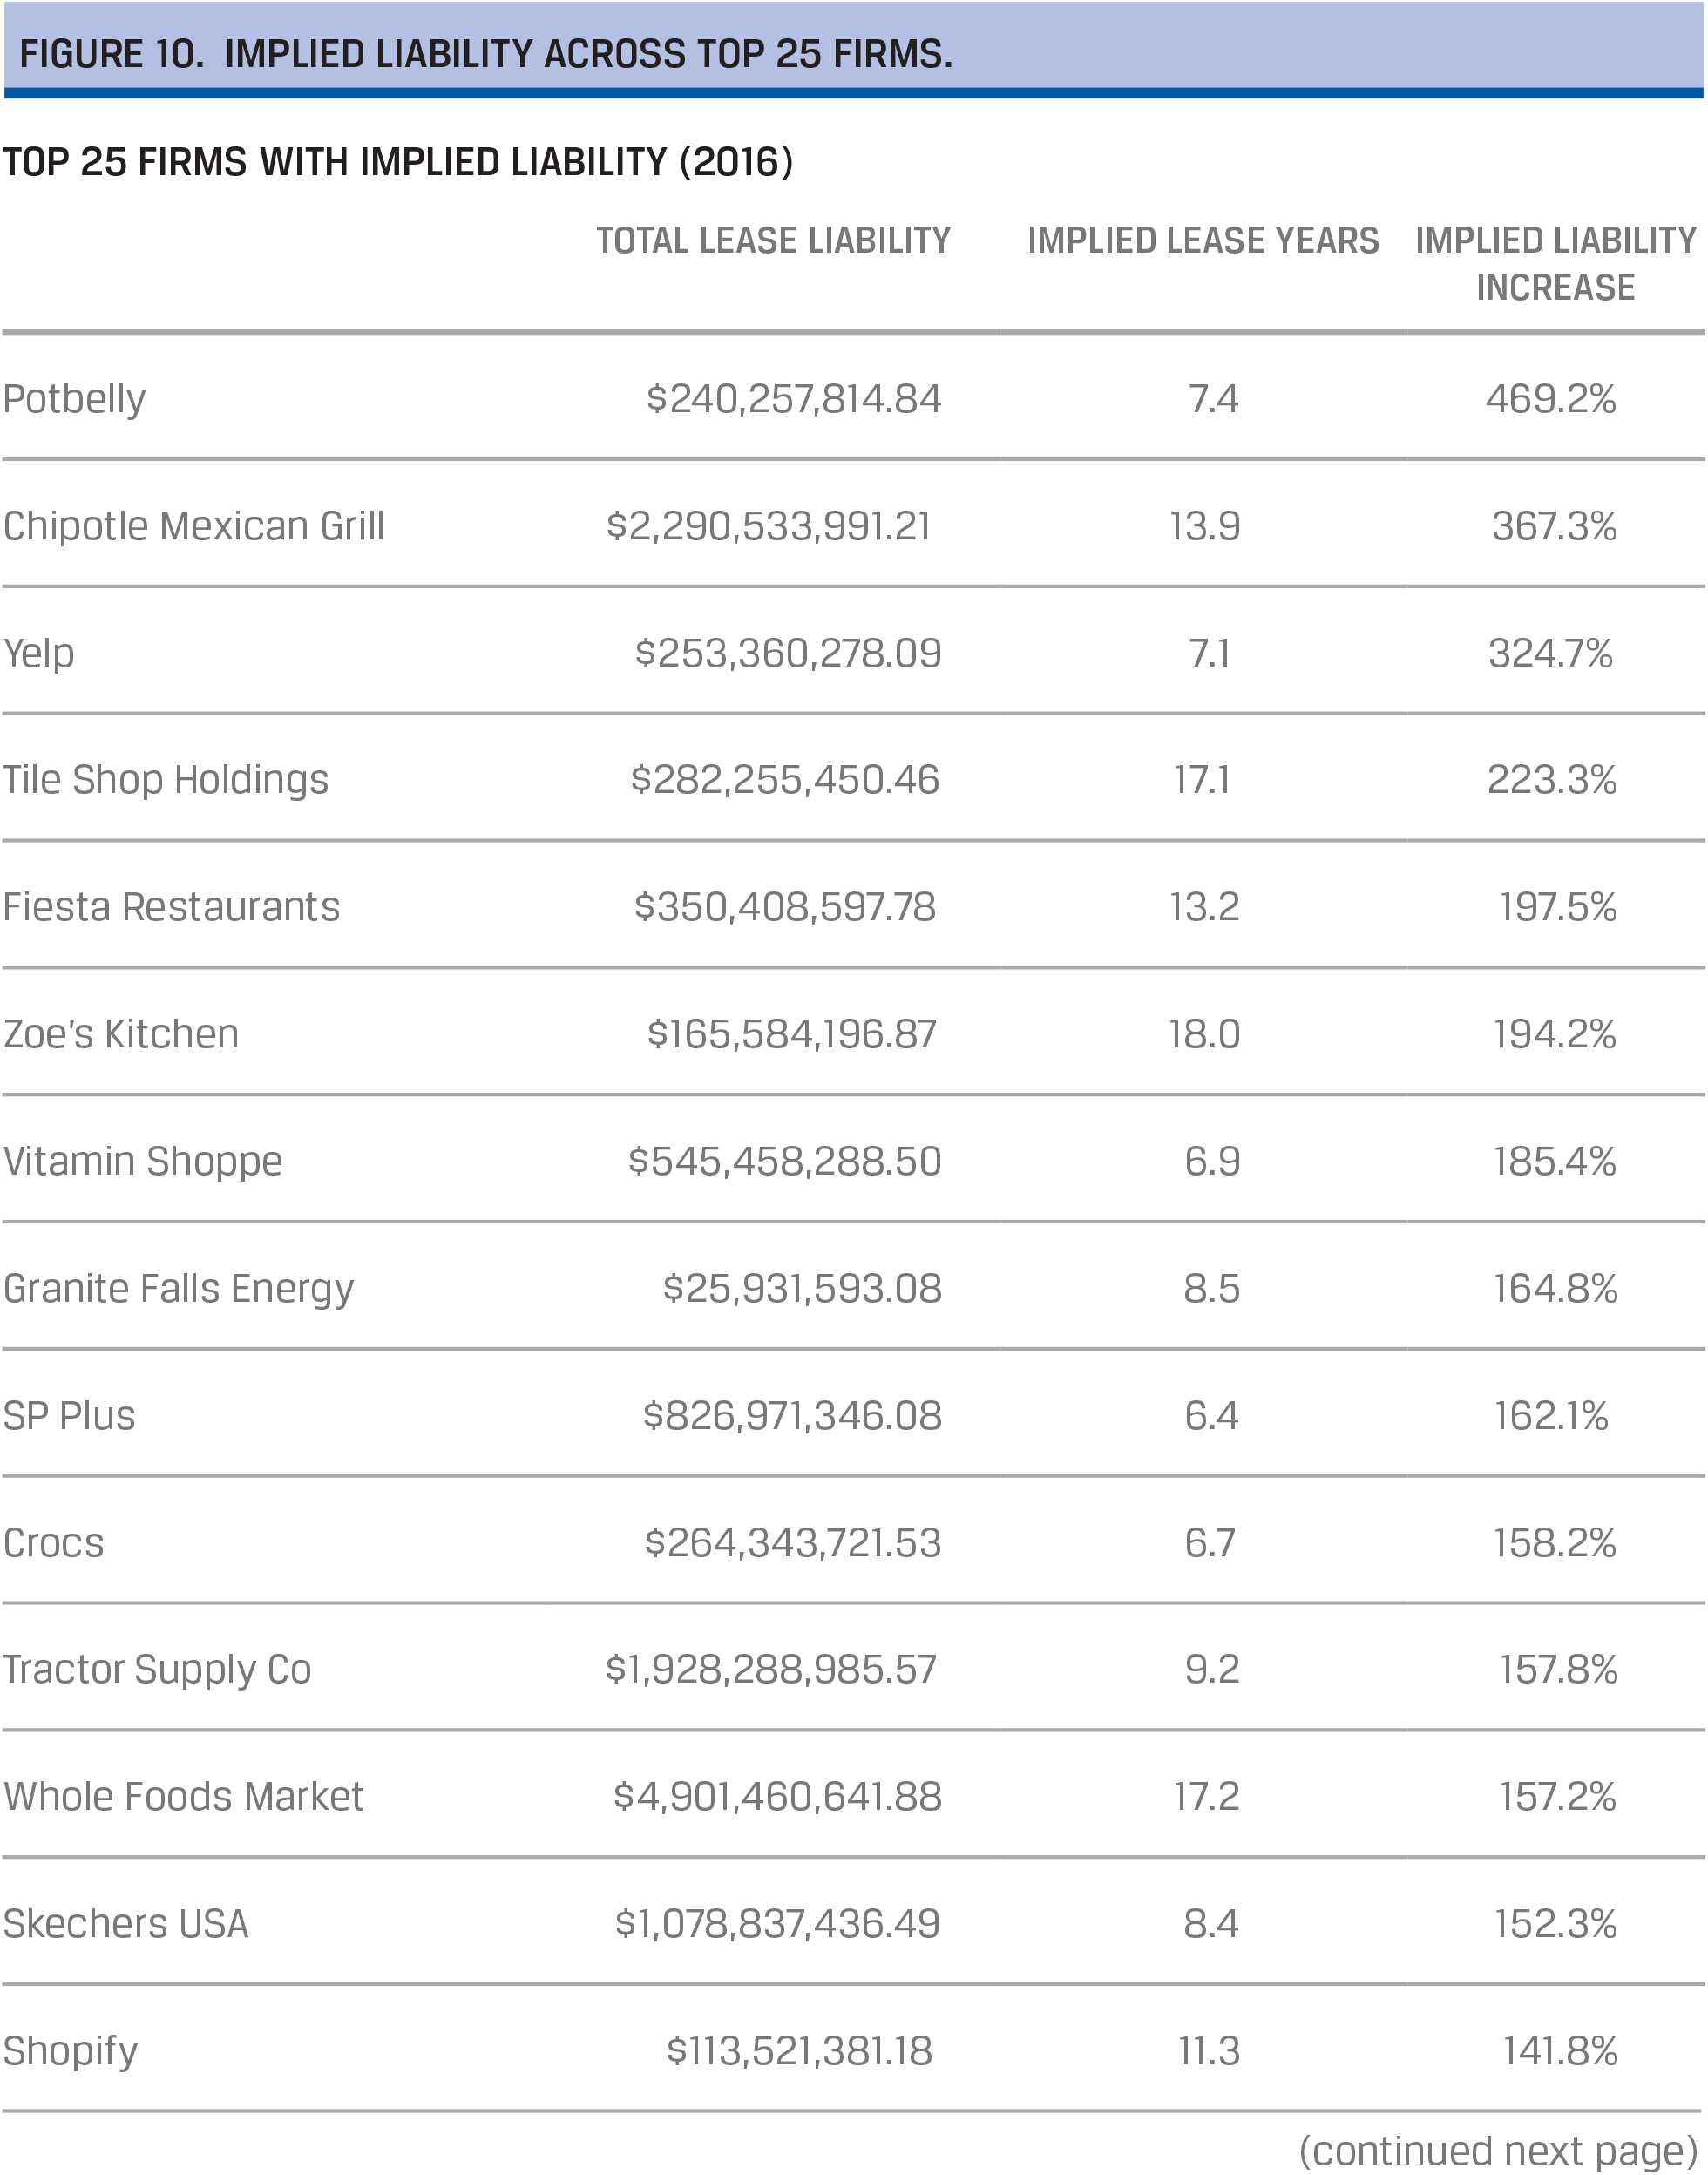
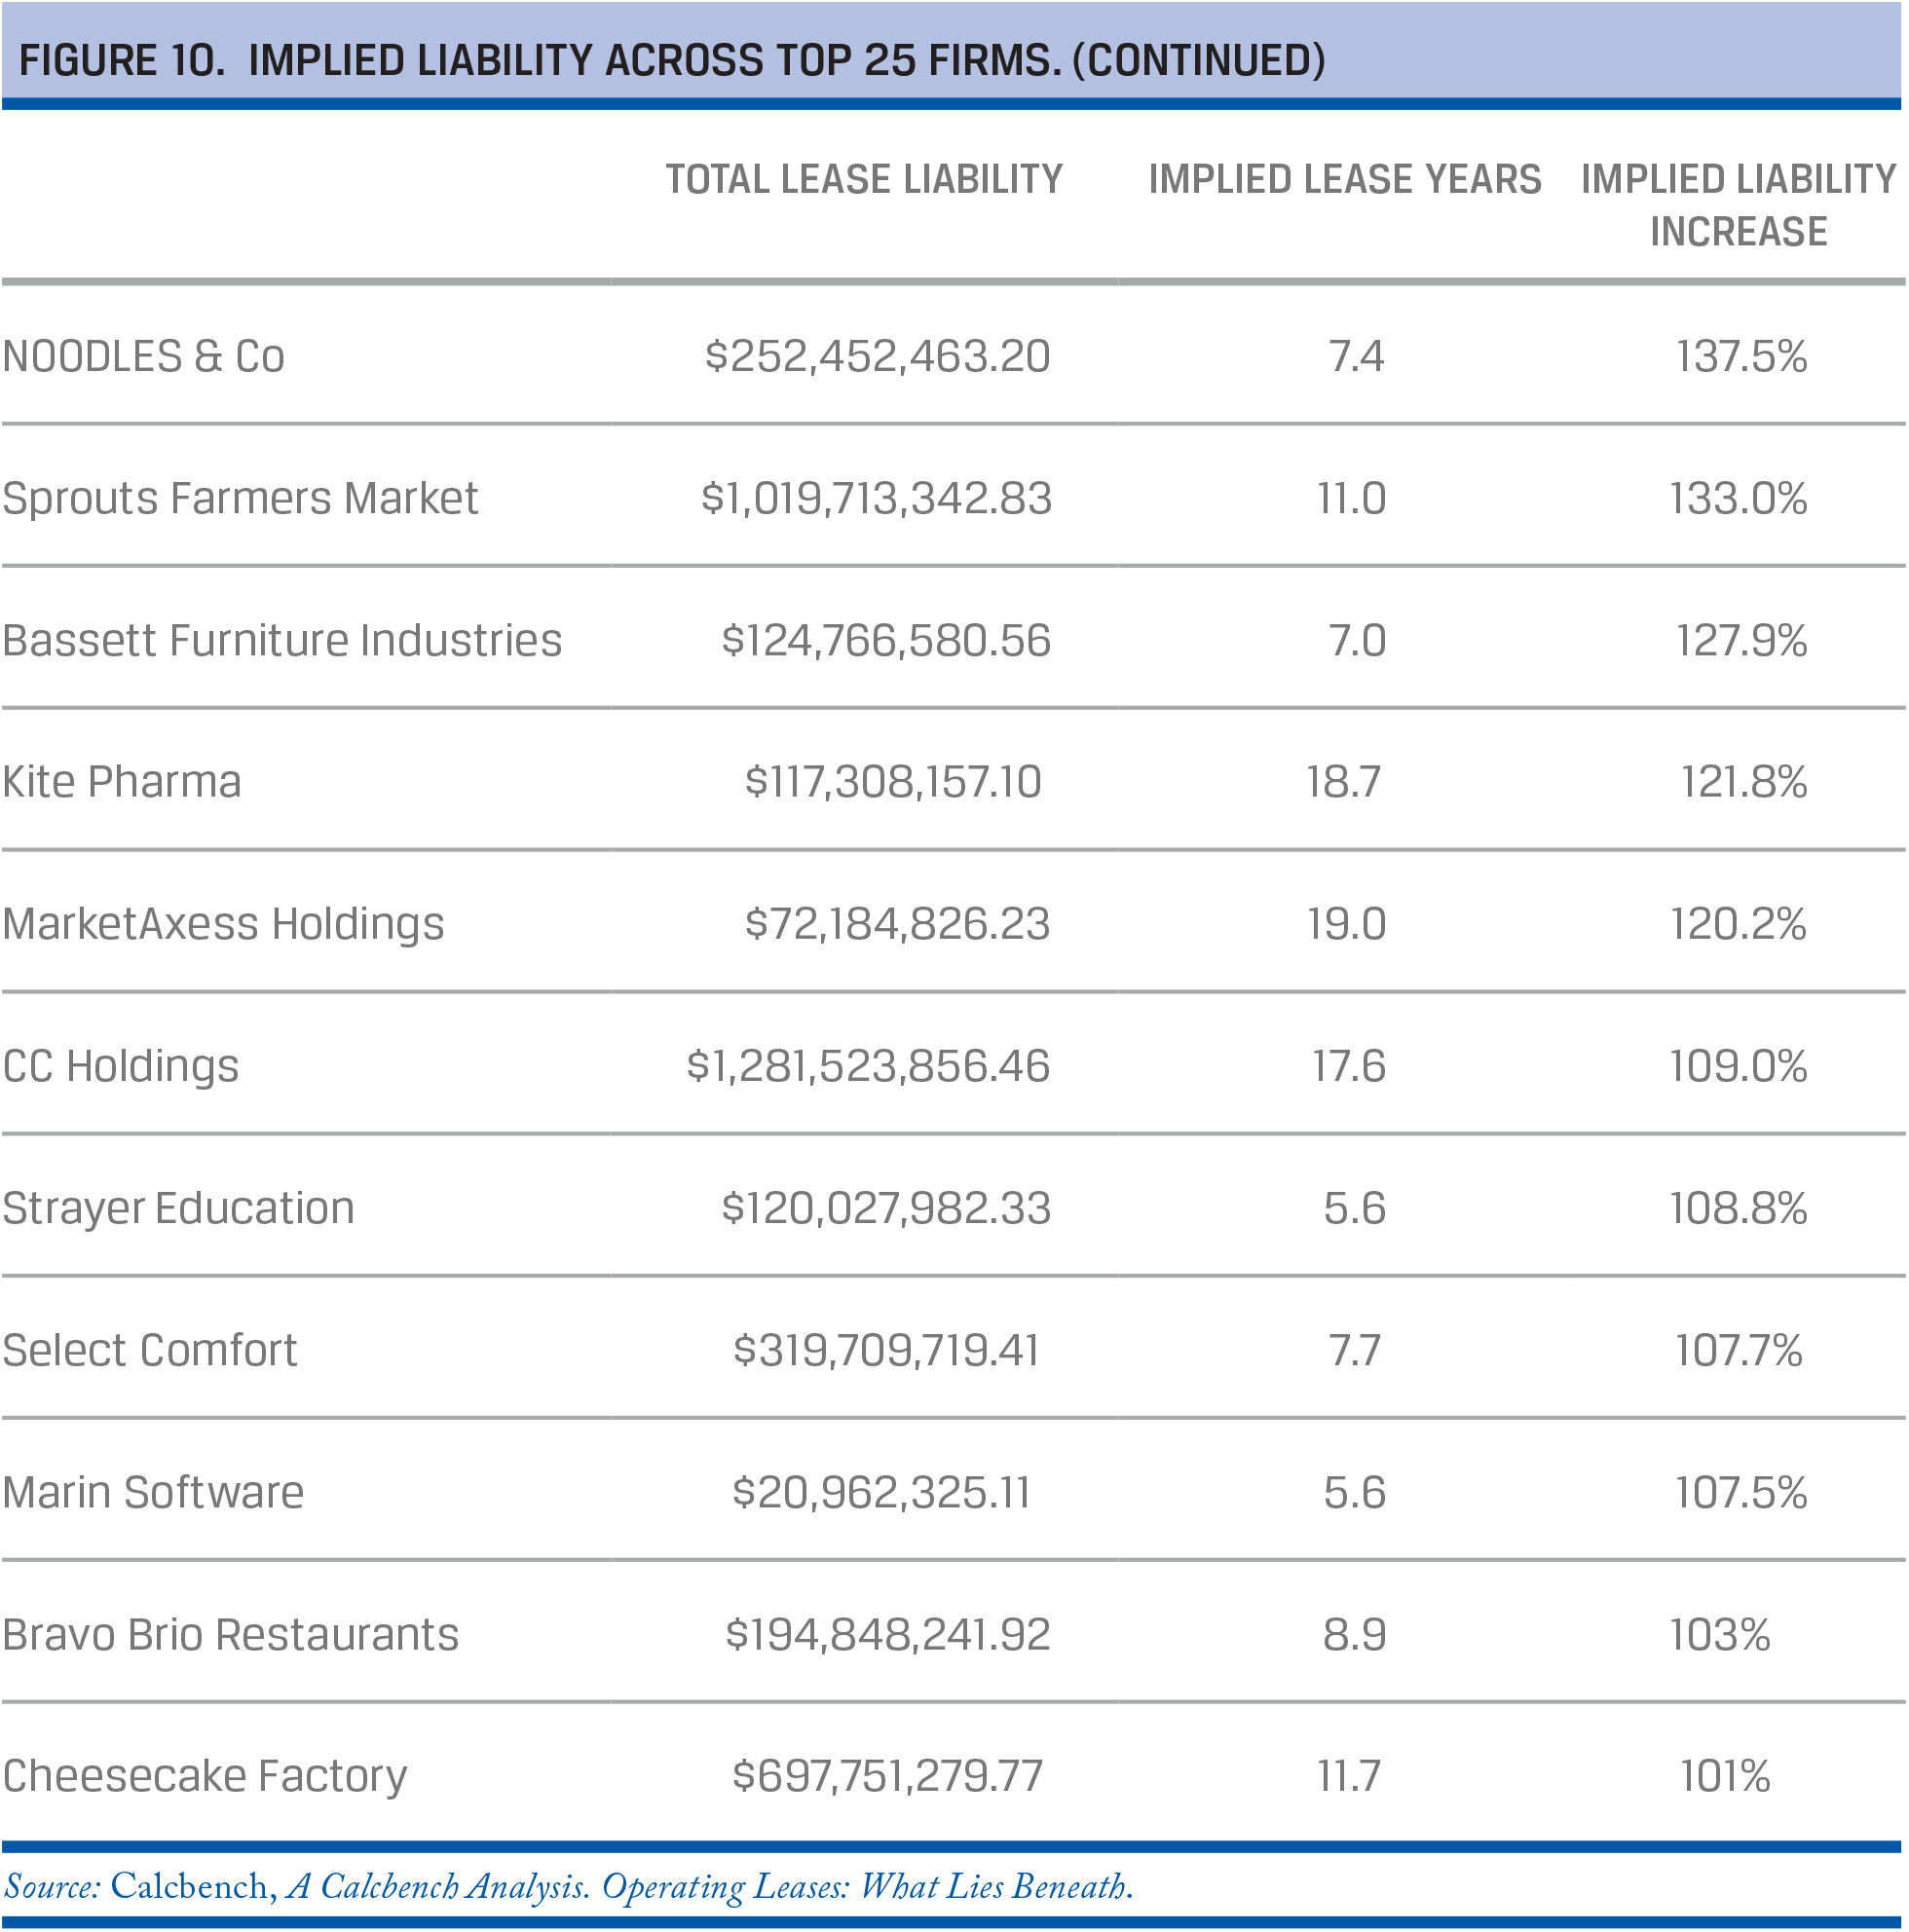
Calcbench used an Excel template to analyze the present value of all lease obligations across firms (Figures 9 and 10). The firm used a discount function with an interest rate of 3%, which was scaled by 50 basis points per year to calculate total lease liabilities for more than 1,500 companies.
The study revealed that
- firms are not required to put some $586 billion in debt through operating leases onto their balance sheets until December 2018;
- consumer discretionary is the biggest lessee, meaning this sector will be most affected by the new FASB regulation; and
- more than 25 firms will have under-reported their leasing liabilities by more than 100%.
Are Data Being Used
Despite the availability of data and the advanced consumption tools being built to access data, the preparer community continues to assert that the data are not being used. Let’s consider a few studies.
The Center for Excellence in Accounting and Security Analysis at Columbia Business School conducted a detailed study8 on how investors, analysts, and other data-seekers in the market are using XBRL-tagged financial data. To assess the use of XBRL, they held a roundtable (including representatives from regulators, academia, preparers, data aggregators, sell-side analysts, and buy-side portfolio managers), conducted interviews, and conducted a survey.
Most strikingly, the report illustrates the contrasting views of preparers and investors. Of preparer perspectives, the report states,
- Most filers we surveyed doubt whether any investors are using their XBRL data and believe they are bearing an unnecessary incremental cost with any benefits going to data aggregators who resell the data and can reduce their own data collection costs. They also want to limit the quantity of data being tagged and filed because of their concerns that no one demands certain data at present.
Conversely, the summary of the investor–analyst survey and interview findings states,
- The core finding is that there is clear demand for timely, structured, machine-readable data including information in financial reports, and that this need can be met via XBRL as long as the XBRL-tagged data can reduce the total processing costs of acquiring and proofing the data, and that the data are easily integrated (mapped) into current processes.
- With respect to SEC filings information, users view access to the full array of footnote, management discussion and analysis (MD&A), and earnings release numerical data as the main reason to consider adapting their workflow to incorporate XBRL-tagged filings.
Concerns among investor–analysts persist regarding
- the reliability of the XBRL-tagged data provided by filers at present;
- unnecessary or excessive use of extensions (filer-specific tags), instead of using standard tags provided by the accounting standard setters; and
- the absence of external auditor assurance on the XBRL filing, and the tags themselves.
The report also states,
- Users are not enticed simply by the notion that the data are “free.” Data quality, reliability, and the availability of easily accessible analysis tools are key drivers of their interest in incorporating new or methods into their existing workflow, and of their technology-driven uses of information. The XBRL-tagged data provide access to information that otherwise would be difficult or expensive to acquire and manipulate, but as much of it is currently focused on financial reporting data available from vendors or is already somewhere on the web, the marginal benefits make it harder to justify costs or effort to create applications to access and exploit the data, especially given the extensive use of unique extensions for similar items, and other data quality issues.
- Finally, we found that less than 10% of our sample utilizes XBRL-tagged SEC data directly from the SEC. . . . However, most of the respondents have looked at the XBRL-formatted financial filings via a software product on the SEC or XBRL US’s websites that provides a “rendered version” (i.e., makes the XBRL tagged documents readable); none of the respondents have accessed XBRL files from a company’s website.
In conclusion, the report finds that investor–analysts:
- want and use interactive data that captures the information in the footnote, MD&A, or earnings release data;
- are interested in the structured tagging of the detailed items in financial statements, in contrast to the claims of the preparers;
- do not require a standard or limited number of data items as indicated by various commentators on the subject of what kinds and amounts of data investors and analysts require (either from financial statements or from other sources);
- extensively use nonfinancial data outside the financial reports;
- utilize data they deem to be useful even if the data are not directly comparable across firms; and
- are looking for easy-to-use XBRL consumption and analysis tools that do not require programming or query language knowledge.
Thus, the demand for a complete set of machine-readable footnote and MD&A data clearly exists for most investors and analysts. As previously noted, however, the data quality and data consumption issues need to be addressed.
Some parties claim that small companies should be exempted from reporting in an XBRL format because investors do not use their XBRL files. Therefore, small companies should not have to bear the compliance burden of preparing them.
The report “Are XBRL Files Being Accessed? Evidence from the SEC EDGAR Log File Data Set”9 explores whether the XBRL files of small companies are being used. The authors
- provide evidence of whether users of financial reports are accessing XBRL files, the XBRL component of an SEC filing. The possibility of exempting small companies from the XBRL mandate was raised in a legislative debate in which some argued that XBRL files are not being used by small company investors. Using data from the EDGAR log file data set, we counted the exact number of user accesses to the XBRL files and their corresponding conventional files in HTML PDF, or text when users access financial disclosures for SEC filings.
The report findings are as follows:
- During the sample period of the third quarter of 2012 through the first quarter of 2015, the study found 12,483,699 valid user accesses to 5,016 unique XBRL filings made by 880 small companies that are subject to the legislation.
- Among the user accesses, 61% are to access XBRL files, whereas 39% are to access the conventional (non-XBRL) files.
- Small company investors not only access XBRL files but also prefer them to the non-XBRL files when both are available to download for a filing.
This report is a direct measure of user access that provides evidence of use of XBRL files of small companies by investors and others.
Structured Data Are Being Used for Varied Purposes
XBRL is not used just for reporting to securities regulators.10 Possible uses for XBRL include reporting to lenders, tax authorities, and other regulating bodies. The following examples illustrate other ways structured data are consumed.
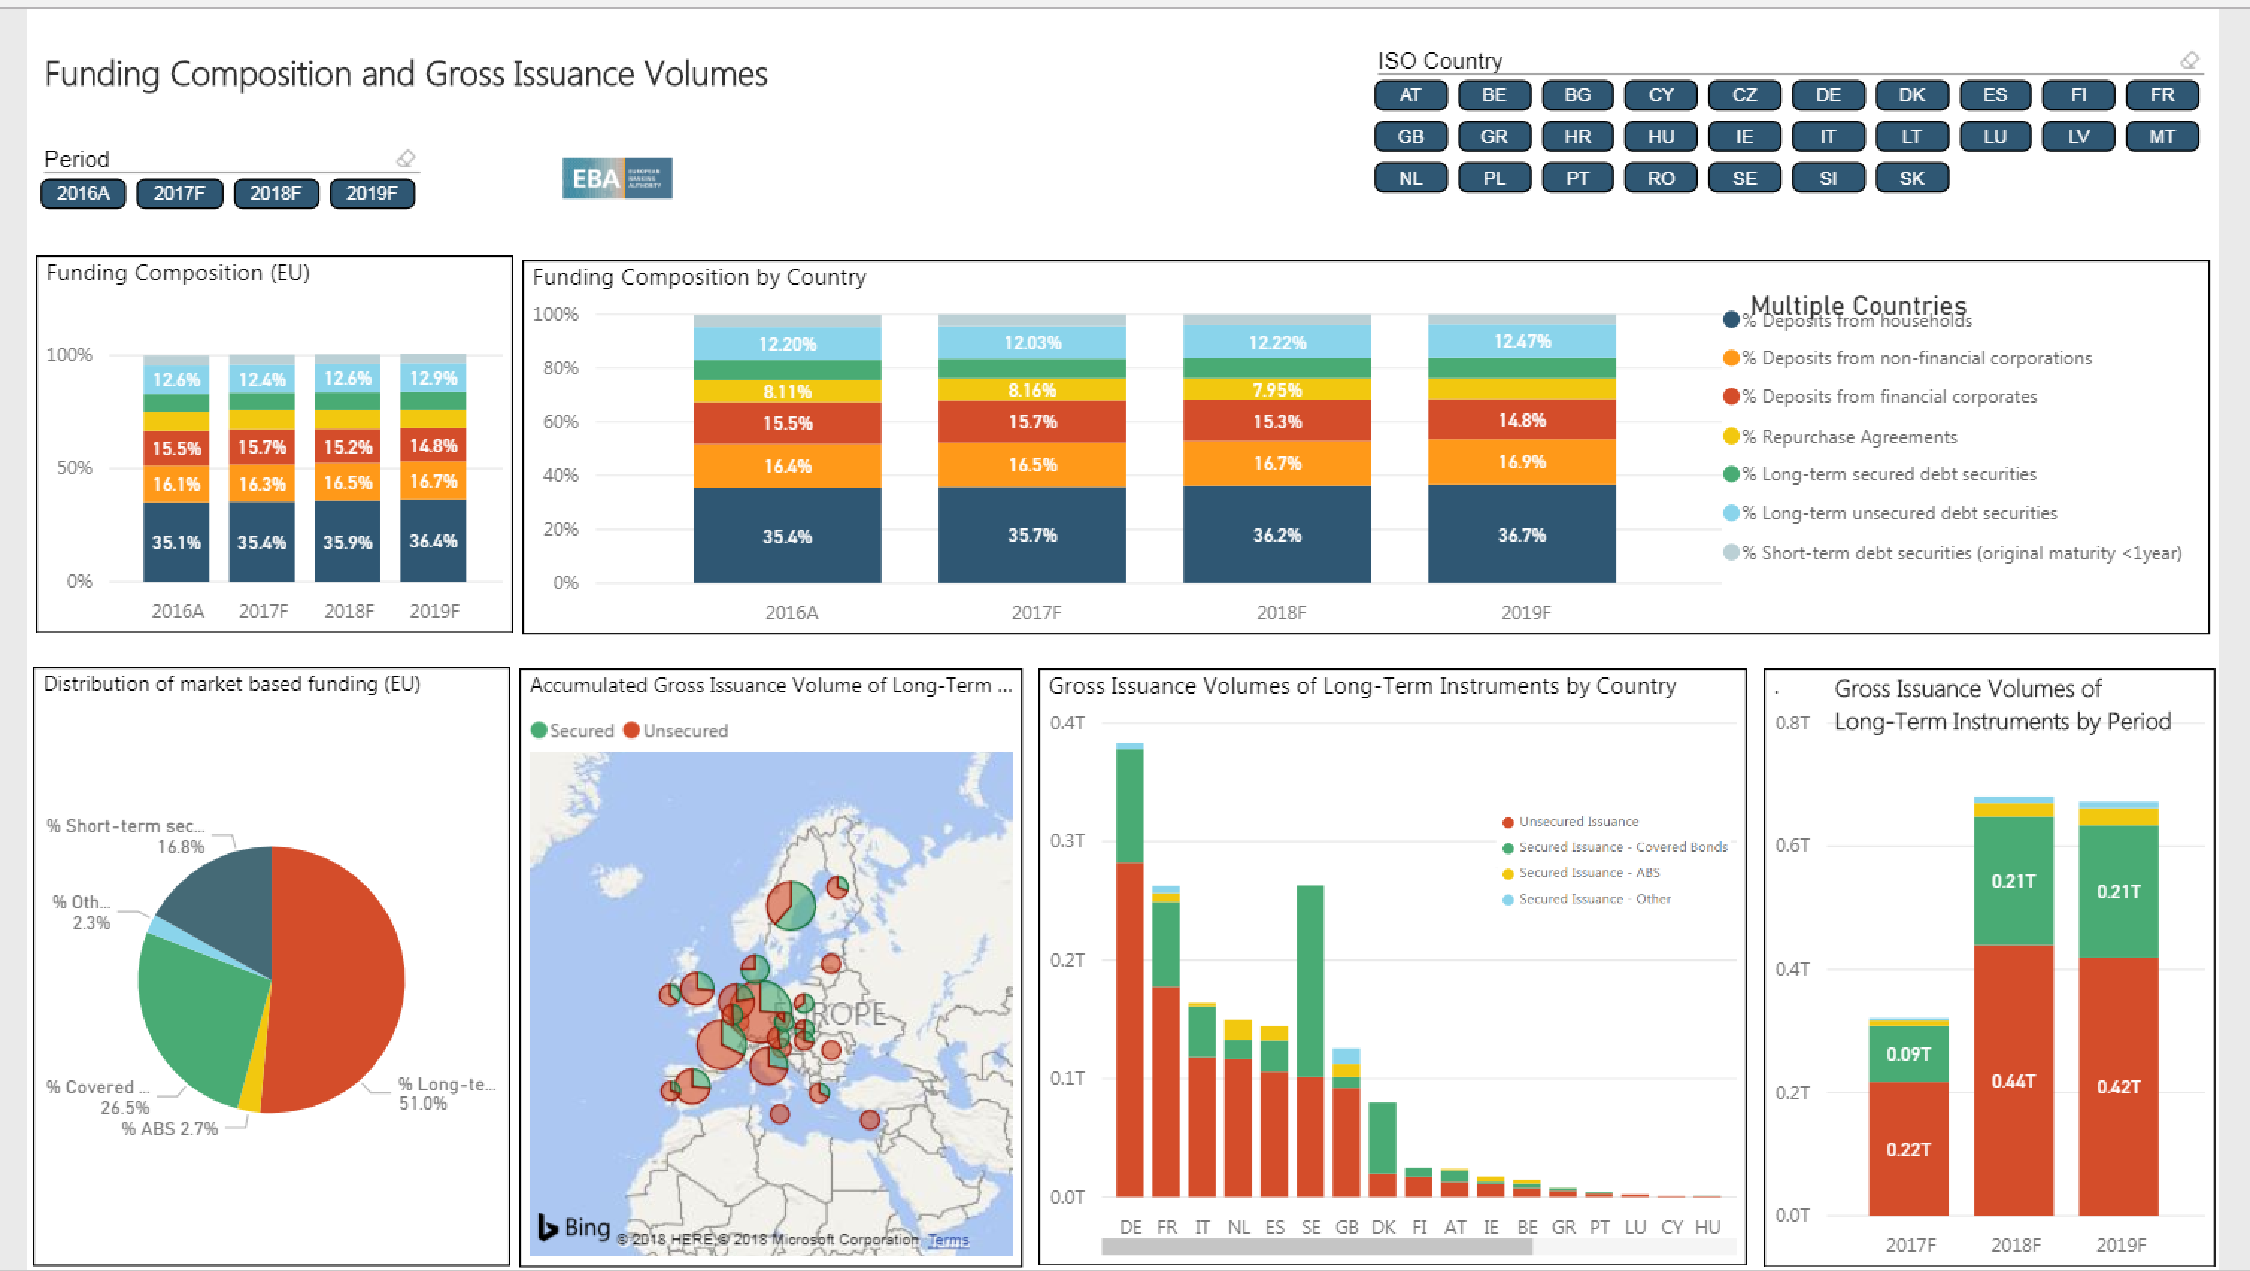
Example: 1 European Banking Authority Produces Aggregate Data
Example 2: Danish Business Authority Applies Machine Learning to Financial Statements
The Danish Business Authority (DBA), Erhvervsstyrelsen, collects XBRL financial statements from the approximately 240,000 private companies that operate in Denmark. It is exploring cutting-edge ways to apply machine-learning techniques to predict possible corporate failures.
The goal is to provide early warning information to entrepreneurs that their companies are exhibiting symptoms that could lead to restructuring, closure, or bankruptcy. The DBA takes historical data about failed institutions through time, applies a range of techniques to their analysis, and then lets machine-learning algorithms create patterns that can be matched against every other company’s data to locate similarities. The DBA is using hard financial measures, like solvency ratios, as well as softer data points, such as changes in the lag between the end of the reporting period and the filing date.
Example 3: Ukrainian Authorities Take a Coordinated Approach to Reporting
Following the passage of new accounting laws (using International Financial Reporting Standards Foundation for disclosure), the Ukrainian authorities, including the Ministry of Finance, the National Bank of Ukraine, the National Securities and Stock Markets Commission (NSSMC), and the National Commission for the Regulation of Financial Services, agreed to a coordinated approach to reporting. Financial statements prepared in Inline XBRL will be filed with the NSSMC and the data then will be distributed to the other agencies that need this information. The data will also be publicly available, improving transparency in this market. Companies affected by the changes, which are expected to come into effect in 2019, include public companies, the financial sector, and a range of large enterprises.
This project seeks to develop an SBR style “report once” mechanism that lowers the administrative burden and reduces implementation costs by simplifying a range of data definitions and using a single portal to submit data to a number of different agencies.
The key goals are to (1) create a single window for submitting financial statements to regulators, (2) provide a high level of automation for collection and processing of financial statements, (3) ensure effective and reliable analysis of financial indicators of companies, and (4) provide rapid detection of mistakes and inconsistencies in financial statements.
Example 4: German Banks Use XBRL for SME Credit Assessment
The German Central Bank—the Deutsche Bundesbank—has been working with German banks (coordinated by XBRL Germany) to develop a small- and medium-size enterprise (SME) credit reporting system that leverages existing capabilities to generate XBRL financial statements for tax reporting. Commercial banks will be able to use these XBRL-formatted financial statements for credit and risk assessment.
Wherever widespread private company financial statements or tax reporting are available in XBRL format, the private sector should leverage these reporting capabilities. The goal is to lower costs and the administrative burden for companies that need to finance their operations and to lower costs and risks for financial institutions.
Example 5: ING Discounts Applications That Provide XBRL Financial Statements
In a similar vein, in 2015, the Dutch bank ING offered discounts on loan and credit applications for its SME customers in the Netherlands if they provided XBRL versions of financial statements through the Dutch SBR platform. When information is provided in this format, banks are better informed about their customers’ financial profiles.
By 2017, ING required its clients and prospective customers to leverage the standard or pay extra to file on paper.
Example 6: State of Florida Implements XBRL Reporting Requirements
In the United States, the state of Florida has more than 400 separate municipalities, including 282 cities. In accordance with US Government Accounting Standards, these municipalities prepare Comprehensive Annual Financial Reports (CAFRs), but their reports are analog.
Given the importance of municipal bond markets to the long-term funding of local and state infrastructure, Florida is moving toward digital government financial and performance reporting. The state is finalizing legislation that will require the collaborative design and implementation of XBRL-based reporting from its municipalities. The CAFRs will be digital and all local governmental financial statements for fiscal years ending on or after September 1, 2022, will be filed in the XBRL format.
Conclusion
Data Are Being Used
Thus far, CFA Institute has seen that the XBRL data being mandated by regulators are being used. The detailed-tagged data provided in a machine-readable format include information desired by investors and analysts. These data can be incorporated into standard spreadsheet files, which are used by many investors and analysts. Additionally, data can be constructed and manipulated according to the end users’ requirements and needs—that is, the sometimes-obscuring presentation and disclosure choices made by a filer or required by regulators can be ignored, and investors and analysts can focus on the data.11
Providers employ powerful AI-based tools along with knowledge of accounting and finance topics, to turn the as-is filed XBRL data into an easy-to-use data set by building their own innovative consumption tools on top of it. The providers also apply machine learning to XBRL data filed with regulators to resolve data quality issues.
XBRL has democratized financial data. It drives transparency and improves efficiency by helping analysts and other users of financial and business information find relevant facts within a few mouse clicks. Analysts can use company-specific financial data from the regulator or providers to model cash flows and returns on capital based on those ideas. They use the data to understand a company’s worth and determine what the market is discounting for revenues and profits. They can also create what-if scenarios to test a company’s sensitivities. More time can be spent on developing hypotheses, analyzing models, and thinking about results rather than on data gathering.
Regulatory Filings Versus Data Providers
Although data providers clean the data for errors found in the filings, they generally provide only a subset of the information contained in the Financial Statement and Notes Data Sets. The primary concern of data providers is to provide comparable information. For example, they may provide users with gross revenue for all companies but not necessarily revenue broken down by products and services.
Some argue that the level of omission in the data obtained from providers is so significant that, despite the data quality issues, the SEC Financial Statement and Notes Data Sets is a better source of information. Others believe reliability is paramount. In the investment world, reliable data help analysts and investors create a base of knowledge to better assess the value of a stock and its associated risks. Reliability also gives investors greater confidence that the analysis is valid and therefore actionable.
In sum, the debate is over using the data from the providers (better quality) or from the regulator (more information).Future Potential
Improve Data Quality
To achieve this potential, data quality needs to be improved. Analysts and investors are concerned about the accuracy, consistency, and reliability of XBRL data. The errors result in inaccurate, incomprehensible, or unworkable files that hinder or prevent automated analysis of the data. As a result, XBRL has not fulfilled its potential to increase the speed, accuracy, and usability of financial disclosure and to broaden the availability of financial data for analysis. Therefore, CFA Institute urges filers to adopt the DQC validation rules. Furthermore, CFA Institute believes that referencing the standard-setter codification to each element will reduce incorrect and inconsistent tagging—both within companies over time and across companies.
To curtail the excessive use of extensions, CFA Institute also believes it is necessary to allow for the use of company-specific extensions within a framework that restricts their use to rare circumstances. In addition, companies should be required to “anchor” all extensions to the base taxonomy by providing an explicit relationship to the base taxonomy.
Regulators and investors have a role to play as well. Greater enforcement is needed for regulators issuing comment letters with respect to errors in the digital filings. Markets also need to penalize companies for incorrect filings.
Require Audits of Digital Information
Regulators require filers to submit their financial statements in both paper-based and digital formats, but no requirement exists to audit or provide any level of assurance on the digital format.
This lack of accountability is not in the interest of investors. First, more than any other reader, investors are consuming the digital information to make investment decisions. If they are fiduciaries, their decisions affect many others. Second, the SEC is considering and ESMA will require filers to submit their digital information in an Inline XBRL format. This format embeds the machine-readable XBRL tags into the human-readable financial statements. Investors would expect both layers to be audited, and an audit would motivate companies to tag the XBRL data correctly.12
Extend Structured Reporting
Finally, structured reporting is most effective when it is applied broadly to all aspects of reporting—that is, to earnings releases and all regulatory filings, MD&As, proxy statements, and tax reporting.
In sum, better quality information is needed from the as-is filed information. Additionally, to obtain a complete picture of what is happening with companies, the structuring of data must be extended in a machine-readable format. There also needs to be a focus on the development of consumption and analytical tools to improve decision making.