
This In Practice piece gives a practitioner’s perspective on the article “Missing the Mark: Mortgage Valuation Accuracy and Credit Modeling,” by Alexander N. Bogin, William M. Doerner, and William D. Larson, published in the First Quarter 2019 issue of the Financial Analysts Journal.
What’s the Investment Issue?
Determining the value of real estate is often less straightforward than it is for other major asset classes—such as stocks, bonds, and commodities— because real estate is neither homogeneous nor frequently traded. But getting it wrong can have very severe repercussions. Worldwide, real estate has been estimated to be worth over $200 trillion, or double the globe’s total gross domestic product.
House price indexes (HPIs), often used to estimate market values for individual properties, can be flawed. When an index is created over several submarkets in which property values change at different rates, aggregation bias can occur, masking these submarket differences. This bias can mislead investors trying to value an individual asset or determine a portfolio’s expected risk. More granular indexes generally improve model fit. The trade-off is that they tend to increase estimation error—a function of the variance of an estimator—because there are fewer observed transactions.
In this study, the authors look at mortgage transactions over four decades to create local HPIs across the United States. First, they assess how indexes constructed in different ways affect the value of mortgage collateral. They then examine how credit analysis can be improved with localized HPIs.
How Do the Authors Tackle the Issue?
The authors set out to construct HPIs using a repeat-sales methodology. This means they pair multiple price observations of the same property to ascertain an average change across a group. They define eight geographic aggregation levels increasing in granularity, ranging from national to state level, city level, county level, and ZIP code level. They then build a suite of annual price indexes using a dataset of 97 million mortgages for single-family properties purchased or securitized by Fannie Mae and Freddie Mac between 1975 and 2015.
They analyze the relative performance of these indexes using two standard methods. The first is a root mean square error (RSME) of predicted prices, a common evaluation metric to determine model fit. The second is through encompassing tests, which investigate whether predictions can be optimized by using multiple indexes together rather than focusing on a single index. In both cases, they use 80% of transactions in a particular area to create “trial” price indexes and assess their performance against a sample of the remaining 20%.
Finally, the authors model the performance of mortgages by drawing upon a US-wide sample of single-family mortgage originations tracking borrower performance behavior between 1999 and 2014, which encompasses 420,000 loans that represent 1.7 million loan-year observations. They note that a crucial variable driving borrower behavior is a mortgage’s loan-to-value (LTV) ratio: Higher LTV ratios increase the probability of mortgage default. This ratio is relatively straightforward to determine at a mortgage’s origination. For ongoing credit analyses, it needs to be updated with an estimate of current market value, producing a new ratio called the “marked-to-market current LTV” (CLTV). The authors analyze how different measures of CLTV affect predicted outcomes—in particular, how model accuracy is affected by CLTVs constructed using different levels of index granularity.
What Are the Findings?
The authors find that as the HPIs they have constructed become more granular, they generally produce more accurate estimates of real estate valuations—to an extent. In large cities, real estate prices are best predicted with local ZIP code indexes because of heterogeneity across neighborhoods and differences in housing stock. This is true particularly during periods of booms and bust in housing markets—times when there is substantially more variation in real estate price changes among submarkets.
In rural areas and small cities, the number of observed market transactions is lower and real estate is less heterogeneous. As index granularity increases beyond a certain point, estimation error is a more important consideration than aggregation bias. In these areas, the city-level indexes are often better than more localized ones.
A key finding is that the ideal index is not the same for every area. The encompassing tests suggest that a weighted average of several indexes could produce a superior predictive index, depending on the area being considered and market conditions.
When modeling the performance of mortgages, the authors find that recalculating CLTV ratios with increasingly granular indexes generally improves model fit. National indexes consistently produce the worst results. For both prepayment and default estimations, model fit is nearly always improved with a more granular index. The most localized index does not always reduce prediction error the most: While center-city areas benefit from very fine levels of granularity, in many other cases, moderately granular indexes are more accurate. Again, there is no single index that fits all areas: A combination of indexes representing different geographic levels may be optimal.
What Are the Implications for Investors and Investment Professionals?
This study presents methods that investment professionals can use to assess the suitability of index aggregation in real estate. The authors examine a dataset of almost 100 million US mortgages, which they say surpasses any existing public dataset. The key usefulness of formulating more refined indexes is to help investors better understand the assets collateralizing many credit-based assets.
Alternative asset classes other than real estate that are not homogeneous and trade infrequently—such as private equity and venture capital—also face trade-offs between aggregation bias and measurement error. This study could have broader applications for them. It shows that using more granular indexes often leads to more accurate predictions but also that the most granular indexes—generally the most expensive to compile—are not always optimal.
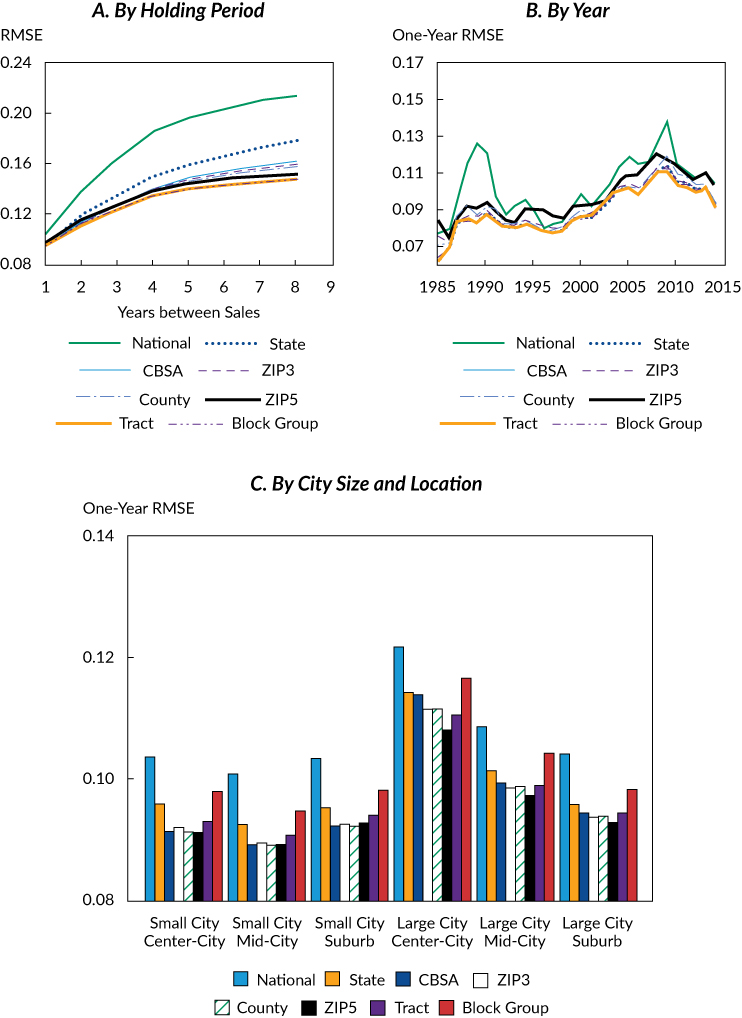
Notes: The indexes were estimated from property valuations between 1975 and 2015 for nearly 100 million mortgages that were purchased or securitized by Fannie Mae or Freddie Mac. Each panel compares modeling errors for HPIs created at different levels of geographic granularity. For comparative purposes, all indexes were formed with the same repeat-sales methodology. We did not substitute values between geographies or switch between competing statistical techniques.