
Emissions Trading Systems (ETSs) are a climate policy instrument designed to provide effective carbon pricing. Carbon traded in these markets can be viewed as an attractive asset class with well-understood risk premium drivers.
This case study from Carbon Cap Management, LLP originally appeared in the CFA Institute report "Climate Change Analysis in the Investment Process."
Carbon as an Emerging Asset Class
Emissions trading systems (ETSs) have proven to be an effective and efficient form of carbon pricing and are an important climate policy instrument, with the ability to mitigate climate change on a large scale. Achieving Paris Agreement climate targets will require the widespread use of carbon pricing to steer the world onto a low-carbon pathway. ETSs cap and reduce emissions through tradable emissions allowances that induce emissions reductions at the lowest total cost to society.
All long-established ETSs have exchange-listed futures markets to enhance liquidity and price discovery, facilitating greater market efficiency and increasing demand within the market. Compliance entities can also hedge their exposure to future price increases. A listed and liquid market allows investors to actively participate in these markets. In 2019, the traded value of three major programmes—the EU ETS, the Regional Greenhouse Gas Initiative (RGGI),1 and the Western Climate Initiative (WCI)2—exceeded $250 billion.
For investors, carbon traded in these markets can be viewed as an attractive asset class with well-understood risk premium drivers. This case study provides a high-level introduction to ETSs as a policy tool for mitigating emissions and also highlights carbon as a potentially attractive asset class for investors.Emissions Trading Systems Explained
Carbon pricing is a policy that aims to reduce carbon emissions by requiring emitters to internalise the societal costs of emissions. Putting a price on externalities, such as carbon emissions, is the most widely accepted means to efficiently correct for this type of “market failure.” Pricing emissions provides a direct economic incentive to reduce them or seek low-carbon alternatives. The two main carbon pricing policy instruments are carbon taxes and ETSs (cap-and-trade programmes, also called compliance carbon markets). A carbon tax places a fee on the carbon emissions content of fossil fuels, and the market then determines the resulting quantity of emissions reductions. An ETS places a cap on the total quantity of emissions and allows the market to determine the price for tradable emissions allowances.
ETSs allow for environmental certainty and least-cost emissions reductions. In an ETS, polluting entities covered by the instrument must submit an emissions allowance for each tonne of greenhouse gas (GHG) they emit. Compliance is mandatory for eligible entities, and their emissions are tightly monitored and audited, with penalties for non-compliance. Entities either purchase allowances through government auctions or, in the case of industries exposed to international competition, receive a portion of allowances through free allocation. A total cap on emissions allowances guarantees that emissions reduction targets will be met, whereas the trading of emissions allowances ensures that the reductions will occur at the lowest total cost to society. Emissions trading incentivises firms with lower abatement costs to maximise their emissions reductions and sell allowances to firms that can only reduce emissions more expensively.
Table 1 summarises the three generic types of carbon markets. ETSs are the most liquid and robustly regulated form of carbon markets. International carbon markets allow the transfer of project emissions reductions among different countries. Voluntary carbon markets provide carbon “offsets” that individuals and companies typically use to offset their carbon footprint. These markets aim to increase the cost-effectiveness of achieving global emissions reductions.
Table 1. Three Types of Carbon Markets
|
Market Elements |
ETS Carbon Markets |
International Carbon Markets |
Voluntary Carbon Markets |
|
Description |
• Mandatory participation for large emitters • Some allow limited amount of international Clean Development Mechanism (CDM) credits |
• The CDM was the first major international market under the Kyoto Protocol • Emissions reductions transferred across countries |
• Independent markets for non-regulated entities to voluntarily reduce emissions • Variety of industry-created standards |
|
|
|
|
|
|
Current Status |
• Covers 8% of global emissions, growing to 14% with the launch of the China ETS |
• Large market, currently stagnating • Article 6 of the Paris Agreement aims to reignite international markets |
• Mainly used for corporate social responsibility (CSR) activities • Attractive for small projects |
|
|
|
|
|
|
Regulation |
• Highly regulated, with robust monitoring, reporting, and verification (MRV) |
• UN-recognised accounting methodologies, such as Gold Standard (GS) accounting |
• Low to no regulation, different accounting methodologies with varying degrees of rigour |
|
|
|
|
|
|
Liquidity |
• Highly liquid • In 2018, more than US$200 billion traded in the WCI, RGGI, and EU ETS |
• Medium liquidity • Average of US$14 billion traded per year since 2006 |
• Low liquidity • In 2018, nearly US$300 million traded |
|
|
|
|
|
|
Carbon prices |
• Range from US$5.7–US$31.5/tCO2e |
• Range from US$0.2–$US0.4/tCO2e |
• Range from US$0.1–US$70/tCO2e |
ETSs have helped stimulate significant emissions reductions and other co-benefits without reducing economic growth. The EU, RGGI, and WCI ETSs are among the longest running ETSs globally. The jurisdictions covered in each of these markets have experienced positive GDP growth with reductions in emissions since their inception, as shown in Figure 1. In achieving the emissions reductions, the EU ETS has facilitated significant levels of coal-to-gas fuel switching in the power sector, which also provided substantial health benefits from reduced particulate matter and improved local air pollution. In the RGGI, emissions reductions in the power sector were accompanied by power price reductions, even as power prices rose in the rest of the United States.3
Figure 1. Change in Emissions and Real GDP in Three Carbon Markets Since Their Inception
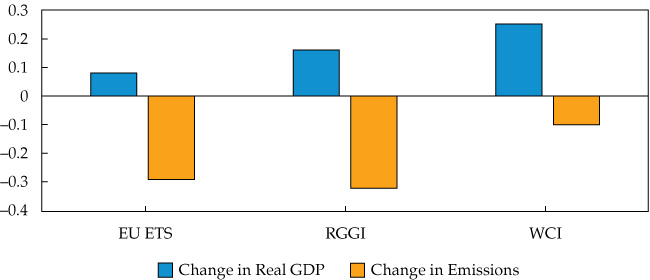
Note: Dates covered include EU ETS: 2005-2018, RGGI: 2009-2018, WCI: 2012-2018.
Source: Carbon Cap based on Eurostat (2019); European Environment Agency (2019); RGGI Inc (2018); Bureau of Economic Analysis (2019); California Air Resources Board (2018); ICAP (2019).
Policymakers have now widely implemented several key policy design improvements that strengthen both the resilience and the environmental effectiveness of ETSs. During the 2008–09 recession, EU ETS GDP declined by around 10% and the carbon price declined from a high of around €30 to a low of around €10. Although a prolonged global recession could still negatively impact carbon prices, modern markets have enhanced features to reduce the impact of an economic downturn on carbon prices and support the robust functioning of this market. These key design features of ETSs, including increasing use of auctioning, free allocation based on efficiency benchmarks, and supply adjustment mechanisms, determine the stringency of a market and influence the expected future trajectory of carbon prices.
Carbon as an Asset Class
Carbon has become a liquid and investable asset class that now trades approximately US$1 billion per day across physical carbon, futures, and options. Carbon has exhibited attractive historical returns and a low correlation with other asset classes, making it potentially attractive within a diversified portfolio. Because of the design parameters of an ETS, including the objective of higher prices and lower emissions, there is a well understood and logical case for a forward-looking risk premium for carbon. At Carbon Cap Management LLP (Carbon Cap), we have created an equally weighted multi-market Carbon Composite time series of allowances prices across four major long-standing ETSs:4 the EU, RGGI, WCI, and New Zealand ETSs. We use this composite to examine the statistical properties of carbon markets from an investment perspective, and for the 2012–19 period, we find the following:5
- The Carbon Composite has generated an annualised return of 22% since 2012 and a Sharpe ratio of 1.08, reflecting a higher risk-adjusted return than traditional asset classes.
- Carbon as an “asset class” has exhibited no correlation with other asset classes, making it potentially attractive as a portfolio diversifier.
- Carbon has a prospective annualised risk premium up to 2030 of between 6% and 12%, based on current prices and climate policy objectives.
The Composite generates significant annualised returns and higher risk-adjusted returns relative to global equity and bond markets. Table 2 illustrates the performance of the Carbon Composite against traditional equities, bonds, and commodities. Aggregating the carbon markets significantly reduces the overall volatility of carbon as a commodity: The Composite exhibits a standard deviation of 19.7%, compared with the average standard deviation of the four individual markets at 39%. Although the Composite still has a high volatility, its Sharpe ratio—measuring risk-adjusted returns—is higher (1.08) than those seen in traditional asset classes, which range from –0.70 to 1.02. Further analysis indicates that there is no statistically significant correlation between the Composite and traditional and alternative asset classes.
Table 2. Carbon Composite Statistics 2012–19
| Financial Properties |
Carbon Composite |
MSCI World Index |
Barclays Global Bond Index |
Bloomberg Commodity Index |
| Annualised return |
22.1% |
10.8% | 3.6% | –6.9% |
| Annualised volatility |
19.7% | 10.8% | 2.6% | 11.2% |
| Sharpe ratio |
1.08 |
0.92 | 1.02 | –0.70 |
Although carbon pricing, particularly emissions trading, is becoming increasingly widespread, prices will need to rise significantly over the next decade in order to stimulate the emissions reductions required to stay below the Paris Agreement temperature threshold. A total of 36 national and 23 sub-national jurisdictions have currently implemented some form of an ETS, covering 9% of global annual emissions and 42% of global GDP.6 A further 9 jurisdictions are in the process of putting an ETS in place, and another 15 jurisdictions are considering doing so.
The majority of emissions covered under a carbon price, however, have a price of less than US$10/tCO2e. Numerous academic studies suggest that carbon prices need to rise between US$50 and US$100/tCO2e by 2030 to be consistent with Paris Agreement goals.7,8,9,10 As such, carbon prices will need to rise substantially if we are to successfully stimulate emissions reductions on the scale required. Based on these price targets, we calculate a prospective risk premium of 6% to 12%, based on a 2% risk-free rate, as shown in Figure 2.
Figure 2. Projected Annualised Return vs. Future Carbon Prices
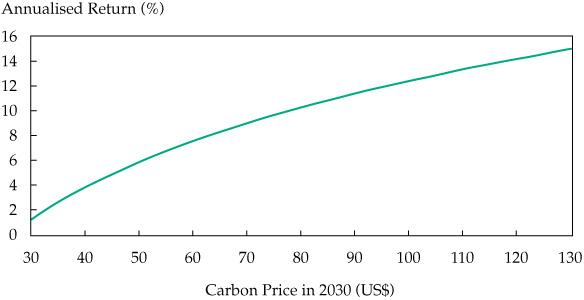
Source: Carbon Cap.
Conclusion
The world’s current greenhouse gas emissions trajectory will continue to result in dangerous and costly climate change impacts, both societally and economically. The earth is on course for an average temperature increase of 3–4°C by 2100 unless CO2 emissions are reduced.11 Climate change of this magnitude will result in substantial human migration, regional conflicts over increasingly scarce resources, and extreme weather events, causing devastating physical damages and economic costs. Carbon pricing is an essential tool that works within a market economy to change behaviour and reduce emissions at scale in order to avoid the worst damages of climate change.
ETSs are the most cost-effective means of carbon pricing, with a high degree of environmental integrity, and they have evolved substantially over the past decade. Through the combination of an annually declining emissions cap and emissions allowance trading, ETSs provide the environmental certainty of achieving emissions reduction targets with the economic benefit of incentivizing this to occur at the lowest possible cost. ETS markets have evolved substantially since their inception, with modern policy design features providing for more stringent markets and greater market resilience in the event of unexpected demand shocks.
Carbon (emissions allowances from ETSs) has emerged as a liquid and investable asset class that may be attractive for long-term investors because of its liquidity, correlation properties, and prospective risk premium. Carbon has generated impressive historical returns, and although it has exhibited high volatility, its risk-adjusted returns have outperformed traditional asset classes, such as equities, bonds, and commodities. If carbon prices rise to US$50–100 by 2030, which many estimate would be required for global emissions to be aligned with Paris Agreement goals, this would give rise to a prospective risk premium of between 6–12% to 2030.