
Quantitative portfolios can pursue carbon objectives, but simplistic approaches must be avoided. Investors using quantitative tools need to pay special attention because ESG data are messy, unstructured, and often not normally distributed.
This case study from Man Numeric originally appeared in the CFA Institute report "Climate Change Analysis in the Investment Process."
Introduction
ESG objectives can be implemented in quantitative portfolios through a number of different approaches. In this case study, we look at how an investment manager can meet clients’ objectives of reducing the corporate carbon output using simple constraints in portfolio construction.
Although the implementation is straightforward, we caution against a simple “set and forget” approach. ESG data are unstructured, messy, and often not normally distributed. As such, practitioners should pay special attention when standard quantitative tools are applied to analyze ESG data. Specifically, we look at ways to avoid some of the pitfalls in overlaying carbon data on portfolios and how a careful implementation process can lead to portfolios that achieve the carbon objective while minimizing unintended secondary effects.
The Problem
The simplest approach to integrating a carbon objective into portfolios involves an exclusion list — that is, a list of companies that the asset owner considers “dirty.” For example, one could simply create a list of heavily polluting companies and remove them from the investment universe. Although the exclusion list method is simple and transparent, it forces absolute “yes or no” decisions, which can often mask the subtleties of some corporate activities. For example, although many environmentalists criticize big oil companies for their carbon emissions, these organizations undeniably play a part in our economy today. Rather than excluding all oil companies, should we instead invest in less-carbon-intensive big oil companies that have strong policies and commitments to reduce emissions?
Another method for integrating ESG data into the quantitative investment process involves constraints in the portfolio construction process. This approach involves setting an upper bound on a chosen carbon measure on an absolute or benchmark relative basis — for example, that the portfolio’s carbon intensity (defined as a ratio of carbon emissions to revenue) must be a certain percentage better than the benchmark. Unlike the exclusion list method, the constraint-based approach does not require absolute decisions on particular securities.
Carbon Data Issues
We caution that with a quantitative approach to carbon budgeting, gains in implementation simplicity can be lost in transparency. This issue is particularly acute because the distribution of carbon data is severely skewed. Skewness, although not a problem by itself, can lead to non-optimal portfolio solutions in the presence of other constraints and path dependency. Figure 1 shows Trucost carbon intensity data as of 29 March 2019.1 To meet a specified carbon intensity level, because of the nature of the skewed data, a portfolio manager could divest a few outsized carbon emitters (if they exist) in the portfolio or trim many positions across multiple high-carbon emitters. Depending on how other constraints are set up, the portfolio optimization process might tilt toward either the “sell down a few” solution or the “trim many” solution.
Figure 1. Trucost Carbon Intensity Data Distribution, 29 March 2019
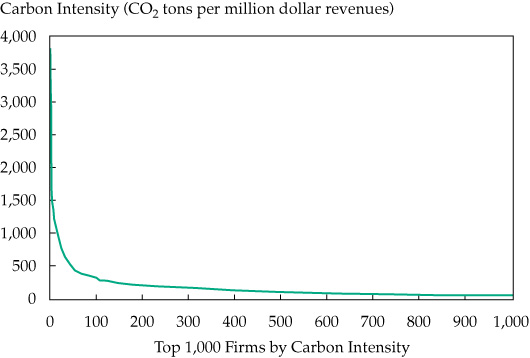
Source: S&P Trucost Limited.2
Figure 2 illustrates a scenario in which the portfolio manager trades off signal exposure with the constraint (or desired exposure) level. When the constraint level is tightened, signal exposure (expected excess return) should fall. A byproduct of tighter constraints is increasing deviation from the optimal portfolio. The holding’s overlap with the optimal portfolio decreases with more-stringent constraints. A benefit of carbon constraints is the ability to achieve meaningful reductions of carbon emissions in one’s investment portfolio (between 30%–40%) without significantly impacting returns. If the data are skewed, however, a portfolio manager will have to choose among multiple paths to achieving a desired exposure that may not all have equivalent signal exposure.3
Figure 2. Simulated Impact of Constraints on Portfolio Signal Exposure and Holdings
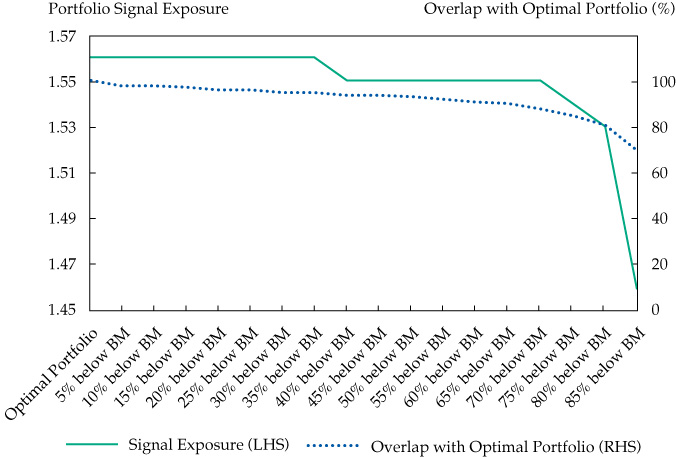
Sources: Man Numeric and Trucost.
The Solution: Systematic Portfolio Construction
The measure of carbon emissions on a carbon-restricted mandate varies based on client preference. Some prefer an absolute measure of carbon emissions (e.g., tons of CO2 emitted from all companies in the overall portfolio), whereas others prefer a relative measure (e.g., carbon intensity or tons of CO2 emitted divided by revenue relative to benchmark). We think it may be useful to use a measure that includes both Scope 1 and Scope 2 emissions—that is, the company’s own direct emissions from sources it controls, as well as indirect sources, such as purchased electricity, heat, or steam.
Carbon data can be applied as a budget or constraint in a systematic portfolio construction process that maximizes portfolio exposure to stock selection models. By applying the constraint systematically, a portfolio manager can ensure that the portfolio will meet the targeted carbon level. Moreover, a risk model can be integrated into this step. This risk model should be dynamic and automatically adapt to emergent market themes. For the purpose of the additional carbon constraint, such a risk model would add an additional perspective to manage the risks arising from the carbon budget.
For most of these strategies, the ESG profile would be further augmented by including a proprietary ESG model in a similar manner to integrating other models, such as value or momentum, in a multi-model context.
Results
In evaluating any quantitative approach to carbon budgeting, one should pay special attention to how the addition of the carbon constraint affects the portfolio’s risk and return profile.
From our experience, we believe it is possible to maintain similar industry/factor/model exposures to non-carbon-constrained strategies for a carbon budget of up to 30% to 40% below the benchmark. We conducted this analysis using Man Numeric stock models and portfolio construction techniques on the MSCI Global Developed Markets universe. Some key observations include the following:
1) No meaningful sector tilts. Our research indicates that for mandates with carbon budget requirements, managers are for the most part able to maintain tight (± 5%) industry bounds relative to the benchmark. As one lowers the carbon budget, the portfolio begins to tilt away from carbon-intensive industries. We note, however, that for budgets up to 30% to 40% below the benchmark, industry bounds of up to ± 5% relative to benchmark are easily achievable because of the skewed carbon data.
Table 1 shows the distribution of the carbon intensity Scope 1 and 2 data provided by Trucost. In the high-carbon-intensive Energy and Materials sectors, although the median carbon intensity Scope 1 and 2 value is high, its distribution is wide. For example, the 5th and 10th percentile values in these sectors are significantly lower than the median values, which allows for easy substitution within the sector. The most carbon intensive sector in the MSCI World Index is the Utilities sector. We note, however, that this sector has only a 3.4% weight (as of 29 November 2019) in the MSCI World Index.
Table 1. MSCI Global Developed Universe, Carbon Intensity, 29 November 2019 (CO2 ton per US$ million in revenue, Scope 1 and 2 emissions
|
|
5th Percentile |
10th Percentile |
Median |
90th Percentile |
95th Percentile |
|
Energy |
83 |
135 |
357 |
551 |
1,184 |
|
Materials |
32 |
49 |
713 |
4,183 |
5,237 |
|
Industrials |
9 |
11 |
54 |
672 |
875 |
|
Consumer discretionary |
12 |
13 |
24 |
46 |
56 |
|
Consumer staples |
44 |
49 |
79 |
256 |
265 |
|
Health care |
2 |
4 |
16 |
51 |
59 |
|
Financials |
1 |
1 |
7 |
20 |
33 |
|
IT |
6 |
9 |
17 |
120 |
159 |
|
Communication Services |
14 |
18 |
29 |
53 |
66 |
|
Utilities |
1,065 |
1,152 |
2,024 |
8,264 |
9,594 |
|
Real estate |
5 |
8 |
77 |
241 |
328 |
Sources: MSCI, Trucost.
2) No noticeable impact on performance. In the simulation studies we ran, we found that it is possible to generate portfolios with carbon budgets of up to 30%–40% below benchmark with no meaningful impact on performance. For most quantitative managers, the investable universe is broad and varied enough to offer liquid substitutes in place of high-carbon-intensive names. To limit adverse selection and risk biases in the portfolio, we believe it is important to have a rigorous tool kit for removing unwanted risks and tilts.
For example, the 20% carbon reduction simulation portfolio has a 97% holdings overlap and 99.8% return correlation with the no-budget portfolio. With such a high overlap and return correlation, the two portfolios’ performance does not deviate significantly over time, and we see no meaningful difference in ex post risk–return characteristics.
Yet another measure of portfolio efficiency is “alpha exposure,” which can be thought of as the weighted average exposure of the portfolio to quantitative signals. In a perfect world, alpha exposure can also loosely be thought of as a unit of measure proportional to excess return. At 20% carbon reduction, alpha exposure does not deteriorate, which means that managers were able to find equivalent high-model-ranked names as substitutes.
Table 2 shows the sector breakdown by weight and carbon intensity contribution for various simulated portfolios. Note that although the weight in Energy, Materials, and Utilities is low in these portfolios, these sectors constitute the majority of the carbon budget. In sectors with lower carbon intensity, the portfolio composition is mostly unchanged at various carbon budget levels, which consequently leads to high portfolio overlap and high performance correlation.4
Table 2. Simulated Portfolios at Varying Carbon Budgets, 29 November 2019
|
|
Portfolio Weight |
|
Carbon Intensity Contribution (Weight ´ CO2 tons per US$ million revenues) |
||||||
|
|
No Constraint |
5% Reduction |
10% Reduction |
20% Reduction |
No Constraint |
5% Reduction |
10% Reduction |
20% Reduction |
|
|
Energy |
3.6% |
3.7% |
3.7% |
3.7% |
|
14.5 |
14.0 |
14.0 |
14.0 |
|
Materials |
3.4% |
3.1% |
2.9% |
2.9% |
|
89.1 |
72.4 |
63.5 |
53.0 |
|
Industrials |
10.6% |
10.6% |
10.6% |
10.6% |
|
13.6 |
12.5 |
11.6 |
10.4 |
|
Consumer discretionary |
8.9% |
9.1% |
9.3% |
9.4% |
|
2.5 |
2.5 |
2.6 |
2.7 |
|
Consumer staples |
7.4% |
7.7% |
7.8% |
7.8% |
|
6.9 |
7.2 |
7.3 |
7.2 |
|
Health care |
14.3% |
14.3% |
14.3% |
14.3% |
|
2.7 |
2.7 |
2.7 |
2.7 |
|
Financials |
16.2% |
16.1% |
16.2% |
16.2% |
|
1.3 |
1.3 |
1.3 |
1.3 |
|
Information technology |
18.3% |
18.6% |
18.6% |
18.6% |
|
6.2 |
6.2 |
6.2 |
6.2 |
|
Communication services |
10.4% |
10.4% |
10.4% |
10.4% |
|
3.5 |
3.5 |
3.5 |
3.5 |
|
Utilities |
4.1% |
3.4% |
3.3% |
3.0% |
|
119.2 |
75.3 |
74.1 |
64.0 |
|
Real estate |
1.9% |
2.1% |
2.1% |
2.2% |
|
2.1 |
2.1 |
2.0 |
2.1 |
|
Total |
99.1% |
99.1% |
99.1% |
99.2% |
|
261.5 |
199.7 |
188.8 |
167.0 |
Source: Man Numeric.
3) No significant style drift. We also note that in the simulation studies we ran, we find no significant style drift for carbon budgets up to 30%–40% below benchmark. We measure style using the Barra Global Total Market Equity Model for Long-Term Investors (Barra GEM LT) model. Exposures to such factors as value, quality, and volatility essentially stay unchanged for all the simulated scenarios.
Conclusion
Our research shows that the best way to reduce the carbon intensity of a portfolio is quantitatively, using a constraint in portfolio optimization. The skewed nature of corporate carbon emissions means a manager can create a significantly greener portfolio (in the range of 30%–40%) without a material impact on investment signal, risk exposures, or return.