We’re using cookies, but you can turn them off in Privacy Settings.  Otherwise, you are agreeing to our use of cookies.  Accepting cookies does not mean that we are collecting personal data. Learn more in our Privacy Policy.

Understanding Your CIPM Exam Result

Your Performance on the Exam

After you complete the CIPM® Program exam, we want to ensure you have the information needed to prepare you for the next step in your journey, whether that is preparing for the next level, signing up to retake the same level, or pursuing other opportunities. Your score report gives you important information to use in your decision. Let’s look at the elements one by one.
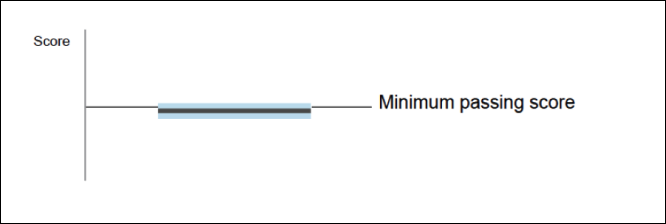
Your Score

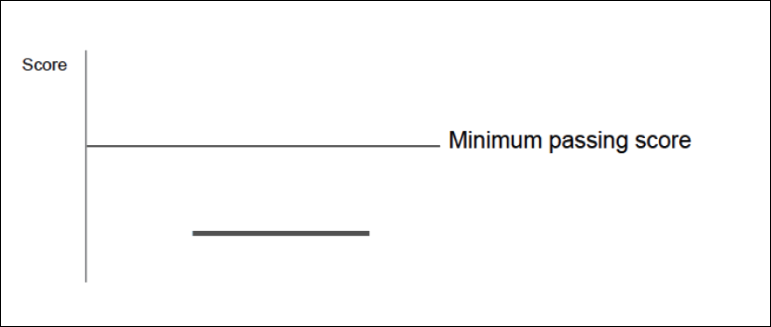
The first thing to notice is the thin solid gray line (). For the overall exam, this line represents the minimum passing score (MPS).

The thick gray line () represents your score on this exam.

  • If it lies above the MPS line, you passed.
  • If your score lies below the MPS line, you unfortunately did not pass.

Your performance on the exam. The graphic displays a vertical line representing the total points available on this exam. The horizontal dashed line represents the minimum passing score (MPS) required to pass this exam. The thick gray line represents your score on this exam. Your score is below the minimum passing score, indicating that you did not pass this exam.

Note: Due to the scale and the way the graphics are rendered, scores that were very close to the minimum passing score may appear to brush against or slightly overlap the minimum passing scoreline.

CFA Institute permits candidates to make factual statements about their exam performance, which includes posting the details of exam performance on social media. However, please note that any such posting must be accurate and should include the year in which the results were achieved.

True Ability

Your score on the exam is influenced by many factors. The most important of these is your true ability, or how thoroughly you know the material. If we could ask you an unlimited number of questions under ideal circumstances, we would eventually be able to determine your true ability. That is not possible, so other factors may influence your score either favorably or unfavorably.

The graphic displays a vertical line representing the total points available on this exam. The light-blue shaded area represents the confidence interval around your overall exam score, or, your likely range of scores under favorable or unfavorable factors. Based on your knowledge on exam day, if you took a similar exam, your score would likely fall within this range.

Favorable Factors

  • We sampled from topics and learning outcomes for which you were better prepared
  • You ate and slept well prior to the exam
  • You had particularly lucky guesses
  • The testing environment was comfortable

Unfavorable Factors

  • We sampled from topics and learning outcomes for which you were less prepared
  • You slept poorly or were particularly nervous
  • Your guesses were unlucky or you made a simple error on a question you would normally get correct
  • The testing environment was distracting or uncomfortable

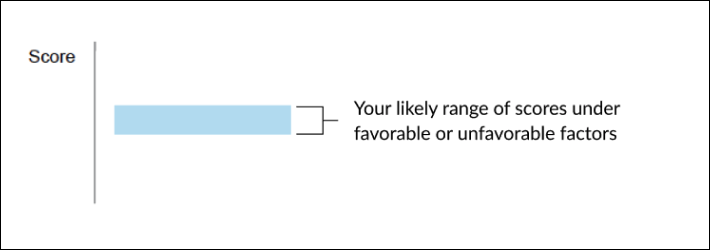
We do our best to control as many of these elements as we can, and your score on the exam represents our best estimate of your true ability. The confidence interval () represents the range by which your score may have been affected by these other factors.

Confidence Interval

The light blue box around your score () represents a 90% confidence interval. Based on the characteristics of the exam, your true ability (as of exam day) probably lies somewhere in this range, as would your scores on similar exams with different questions.

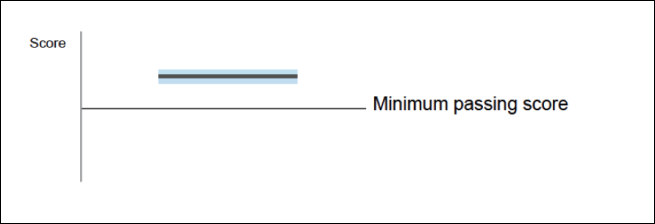
Score and Confidence Interval Above the MPS

A candidate who scores very well could have high confidence that they would have passed under nearly any circumstance.

The graphic displays a vertical line representing the total points available on this exam. The horizontal dashed line represents the minimum passing score (MPS) required to pass this exam. The thick gray line represents your score on this exam. The light-blue shaded area around your score represents the confidence interval. Your score and confidence interval are above the MPS, indicating that you passed the exam, and would have passed under nearly any circumstance.

Score and Confidence Interval Below the MPS

A candidate who scores very poorly can have high confidence they would not have passed under nearly any circumstance, and would need to study much more in order to pass in the future.

The graphic displays a vertical line representing the total points available on this exam. The horizontal dashed line represents the minimum passing score (MPS) required to pass this exam. The thick gray line represents your score on this exam. The light-blue shaded area around your score represents the confidence interval. Your score and confidence interval are below the MPS, indicating that you did not pass the exam, and would not have passed under nearly any circumstance.

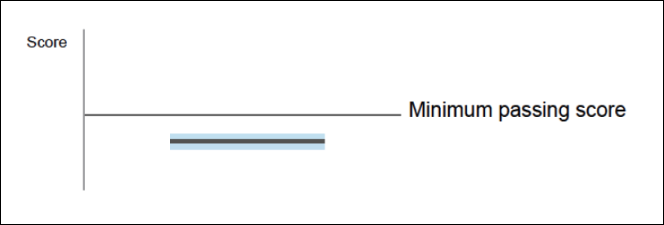
Score Below the MPS but Confidence Interval Overlaps the MPS

A candidate who scored close to the MPS might have passed under some sets of circumstances, but in most cases would not have passed. With a little more studying, this candidate can push the odds in his or her favor.

The graphic displays a vertical line representing the total points available on this exam. The horizontal dashed line represents the minimum passing score (MPS) required to pass this exam. The thick gray line represents your score on this exam. The light-blue shaded area around your score represents the confidence interval. Your score is below the MPS but the confidence interval overlaps the MPS, indicating that you did not pass the exam, but might have passed under some sets of circumstances.

Your Performance by Topic Area

The topic area presentation is very similar to the presentation used on the overall exam, though there are a few important differences.

Signal of Topic Mastery

Note there is not a separate passing score for each topic. Strong performance in one topic area can offset weak performance in another. Therefore, instead of representing the minimum passing score, the thin gray lines (
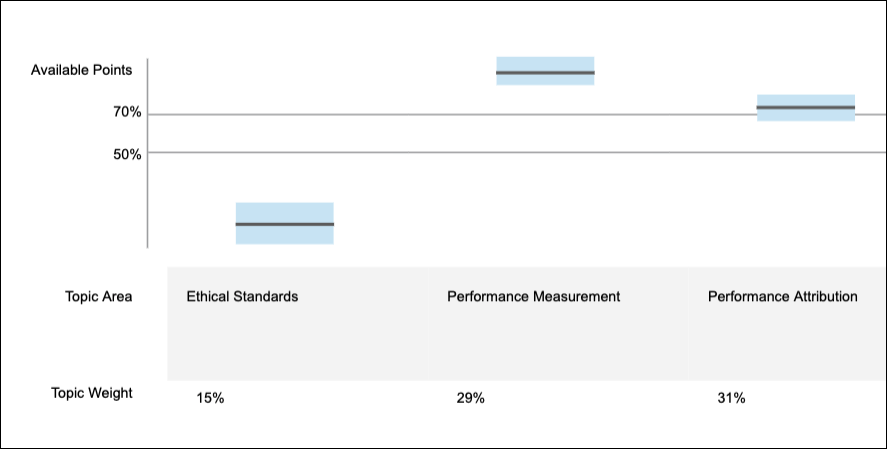
) represent 50% and 70% of the available points in that topic. Although this level is somewhat arbitrary, consistent scores above 70% of the available points is a reasonable signal of topic mastery. If you plan to take another (or the same) level of the CIPM Program exam in the future, knowing how your score measured up for various topics on this exam may help you focus your future studies for the next exam.

Signal of Topic Mastery: The graphic displays a vertical line representing the available points for a given topic. The horizontal thin black lines represent 70% and 50% of available points for a given topic. The thick gray line represents your score for a given topic. The light-blue shaded area around your score represents the confidence interval around that topic area score. Your score and confidence interval are below the 50% line for Ethical Standards. The topic weight for Ethical Standards is 15%. Your score and confidence interval are above the 70% line for Performance Measurement. The topic weight for Performance Measurement is 29%. Your score is above the 70% line for Performance Attribution, and the bottom half of the confidence interval overlaps the 70% line. The topic weight for Performance Attribution is 31%.

Confidence Interval

You will also notice the confidence interval box () for topic area scores is wider than the confidence interval in the “Your Performance on the Exam” section. The confidence interval will be wider when there are fewer questions or a wider dispersion of responses. In such cases, the influence of other factors would be higher. When interpreting topic-area scores, you might want to draw on your own experience for additional help. If you did much better than expected (and your self-assessment is accurate), your true ability might be in the lower half of your confidence interval. If you did much worse than expected, your true ability might be in the upper half. As with the total score, however, the further above 70% you scored, the more confident you can be that you have mastered the topic.

Share on Facebook Share on Weibo Share on Twitter Share on LinkedIn